Profile of the Atmosphere, Lapse rates, and Stability
How is the atmosphere organized and how do key properties of the atmosphere vary through out it
Structure of the Atmosphere
Earth’s atmosphere is thousands of kilometers thick.
- But almost all of it’s mass (>75%) is in the troposphere
- Narrow zone closest to the surface
- Exosphere is a broad transition zone to the vacuum of space
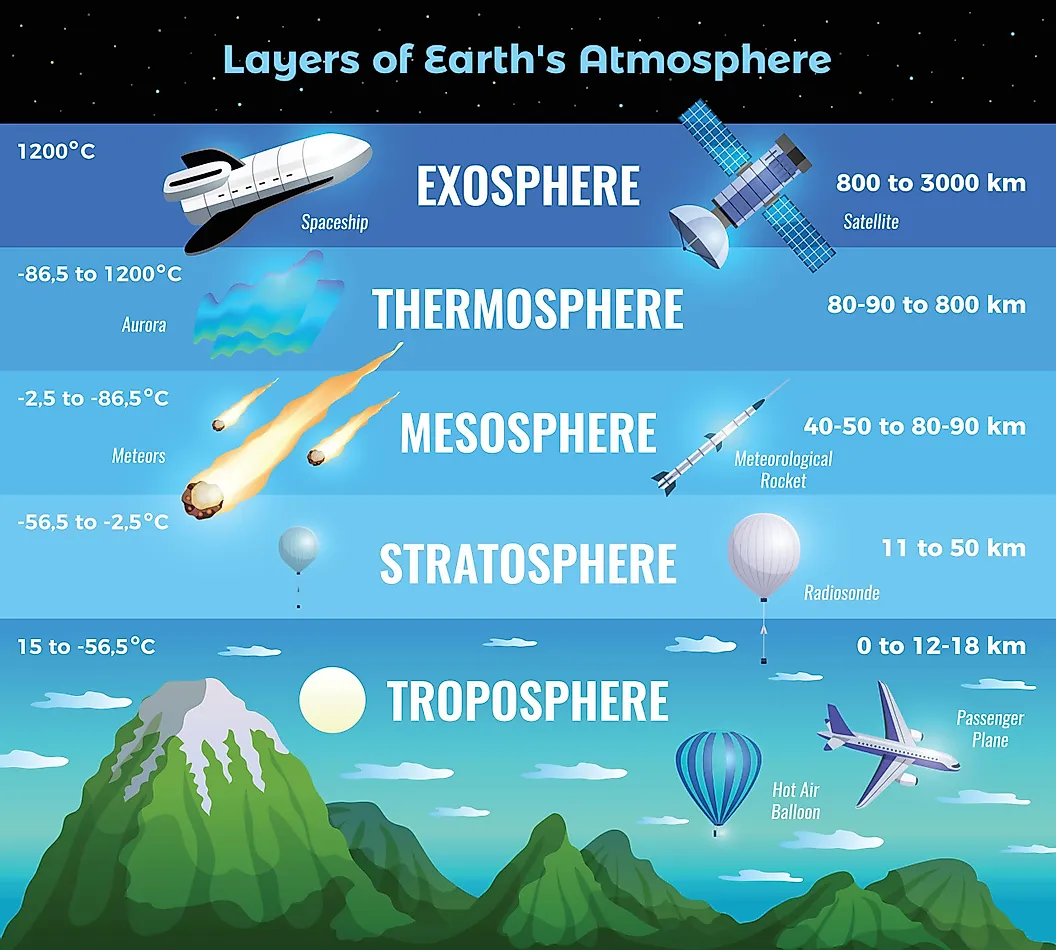
Structure of the Atmosphere
- Thermosphere: absorbs high energy X-rays & UV rays
- Mesosphere: dense enough to burn up meteors
- Stratosphere: contains O3 and protects us from UV rays
- Troposphere: where life occurs
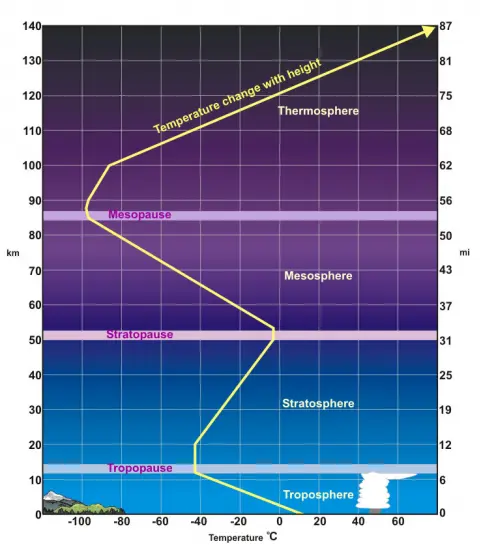
Structure of the Atmosphere
- We are primarily concerned with processes that occur in the troposphere
- The top of the troposphere is demarcated by a temperature inversion
- Known as the tropopause
Mass of the Atmosphere
There are \(\approx\) 1 kg of air above every cm2 of Earth’s surface
- This mass exerts pressure on the Earth’s surface, and everything on it
- We are adapted to it, so we don’t feel it
Air Pressure, Density & Temperature
Air pressure, density, & temperature effected by the the mass of the atmosphere.
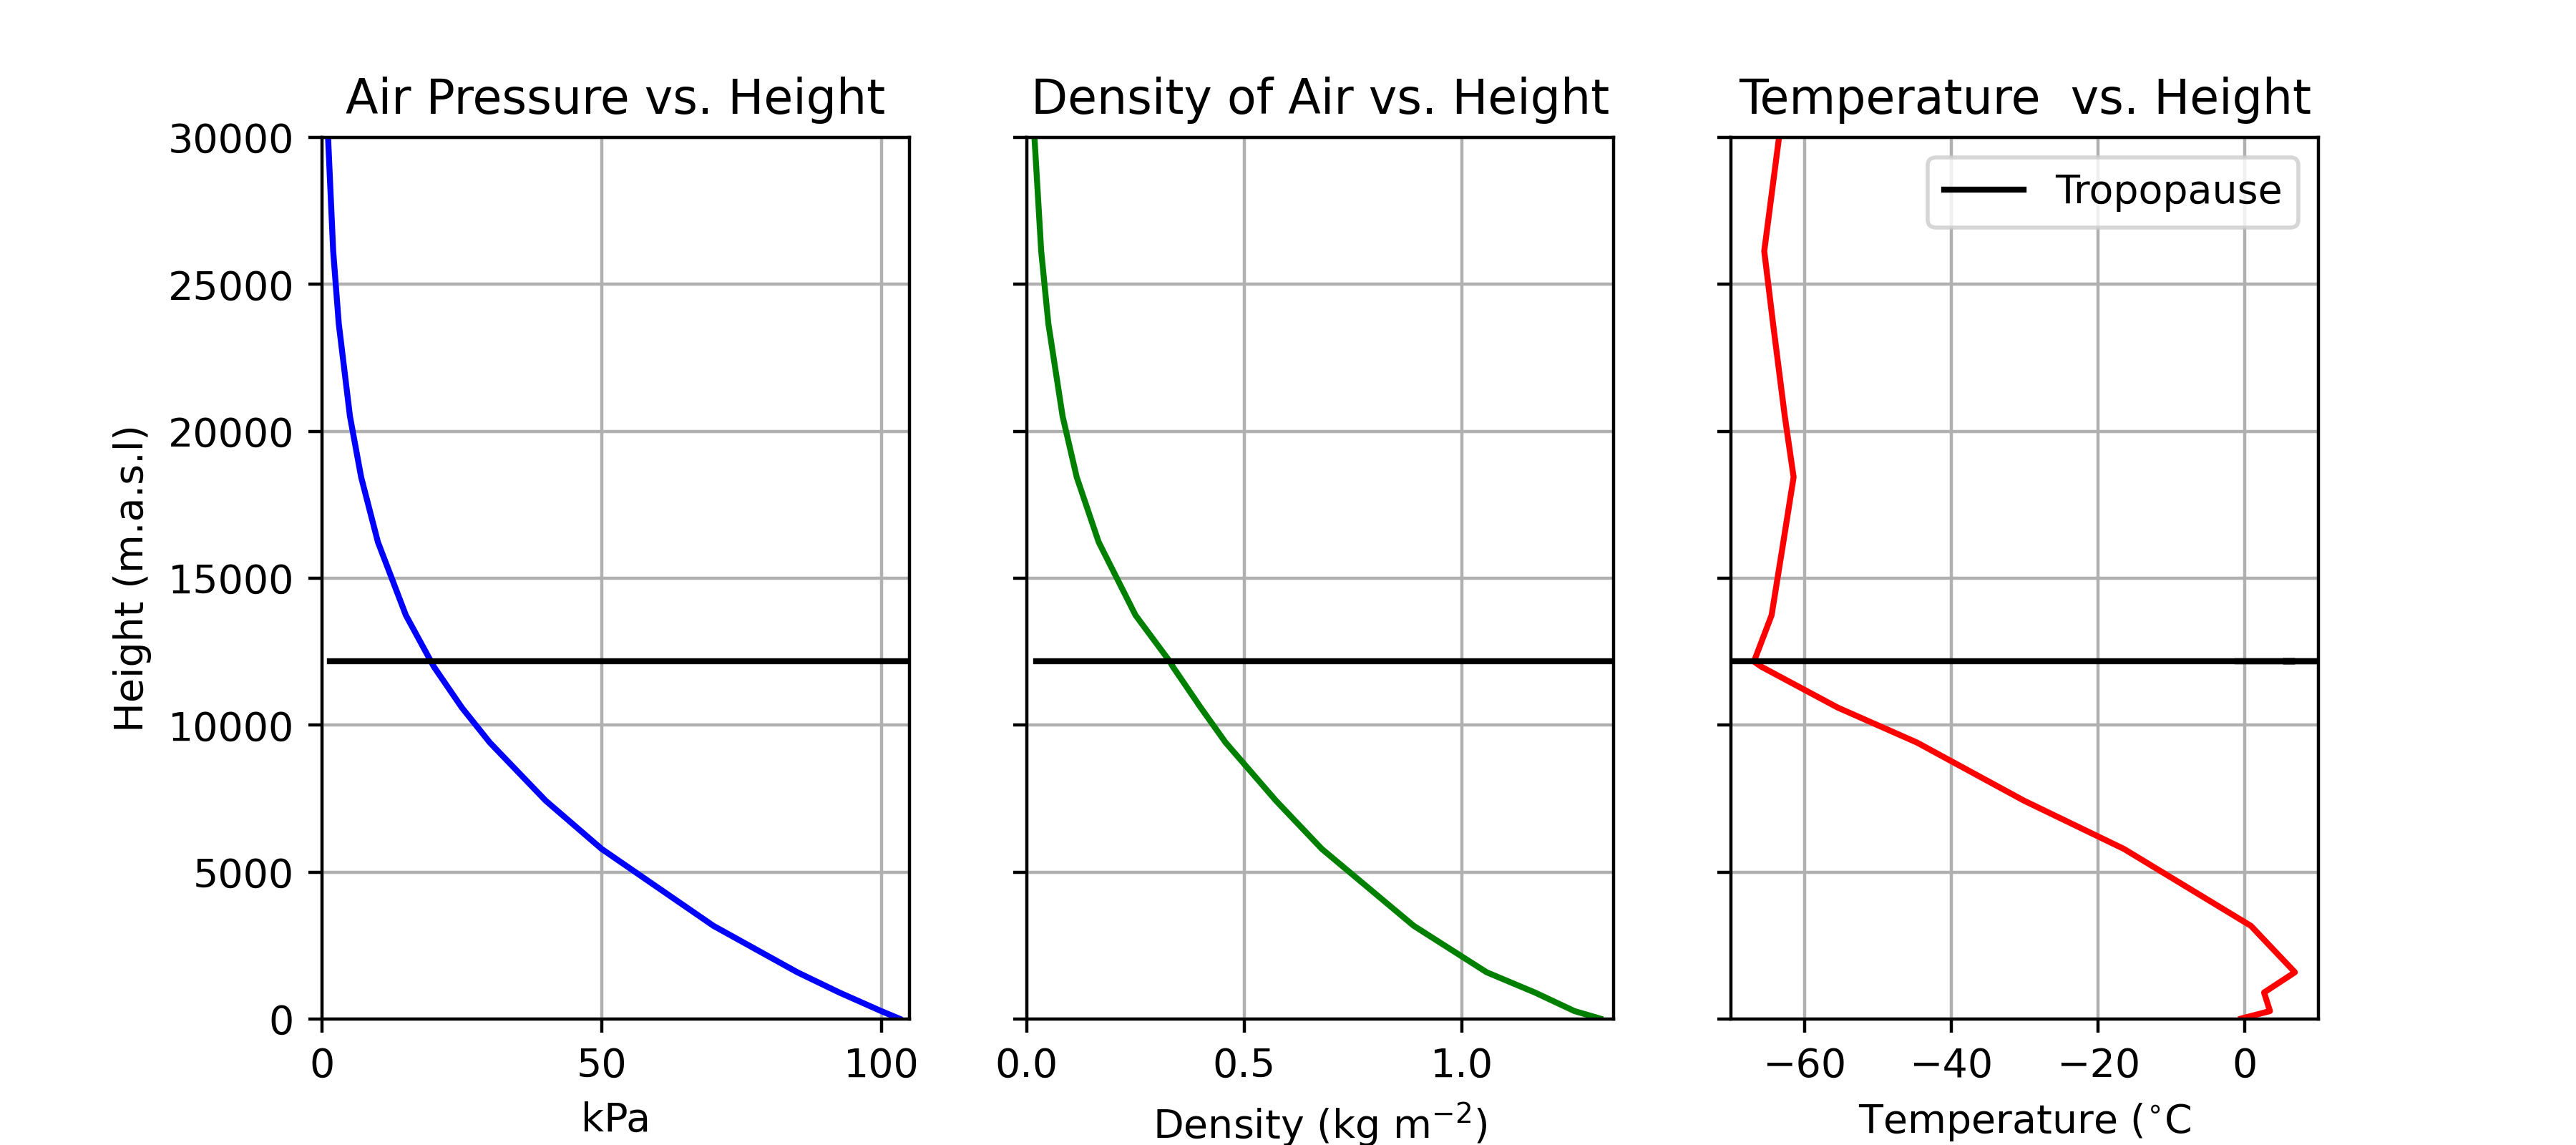
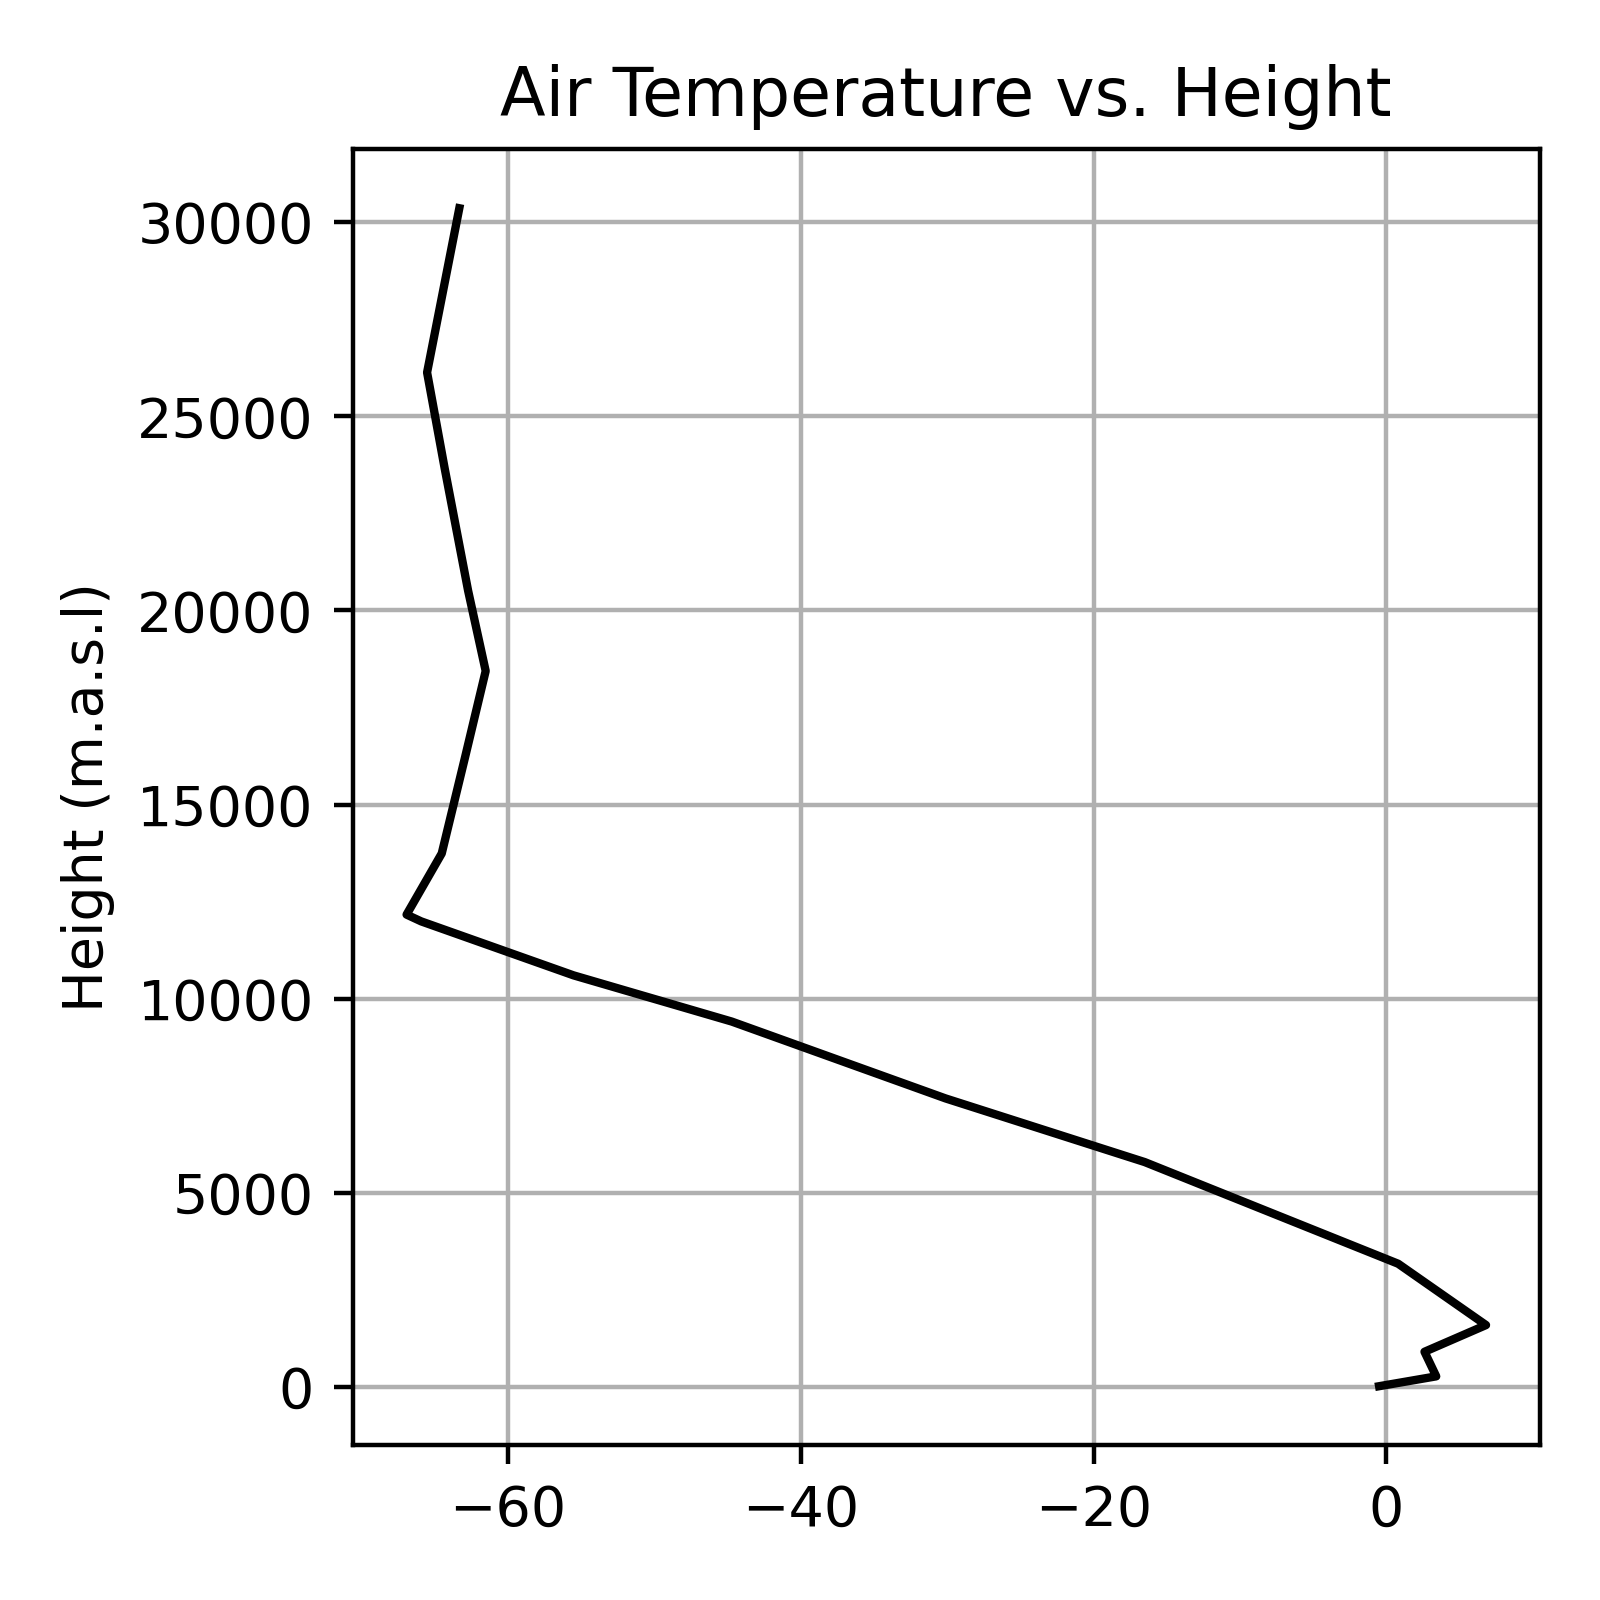
Atmospheric Temperatures
Temperature (generally) decreases with height in the troposphere due to the decrease in air pressure.
- Explained by the ideal gas law
\[ T = \frac{PVM}{Rm} \qquad(2)\]
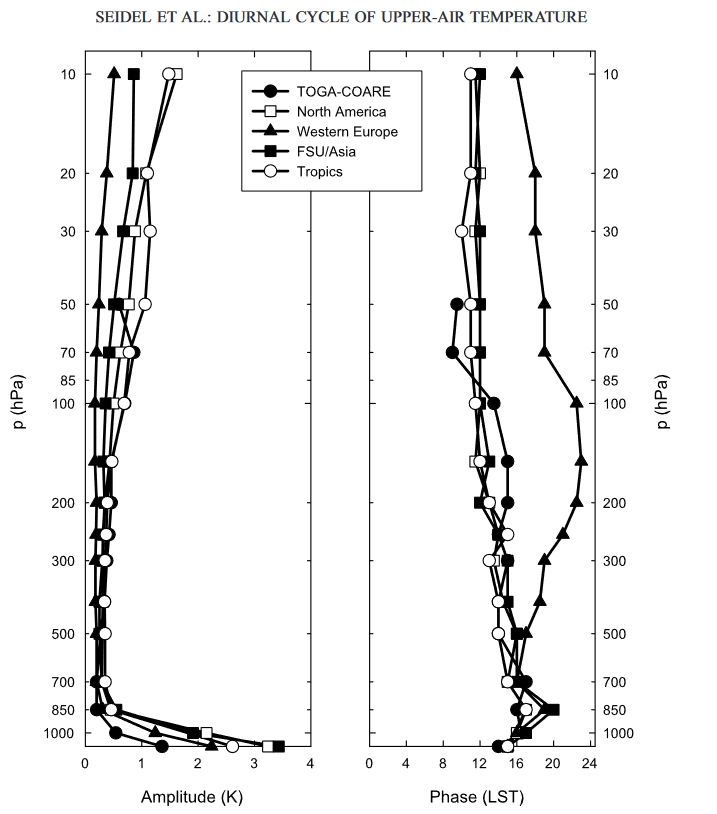
Atmospheric Temperatures
Daily temperature variability in the upper atmosphere is much lower than at the surface.
- Changes at the surface can alter temperature gradients relative to upper levels of the atmosphere
- Can lead to convection (mixing)
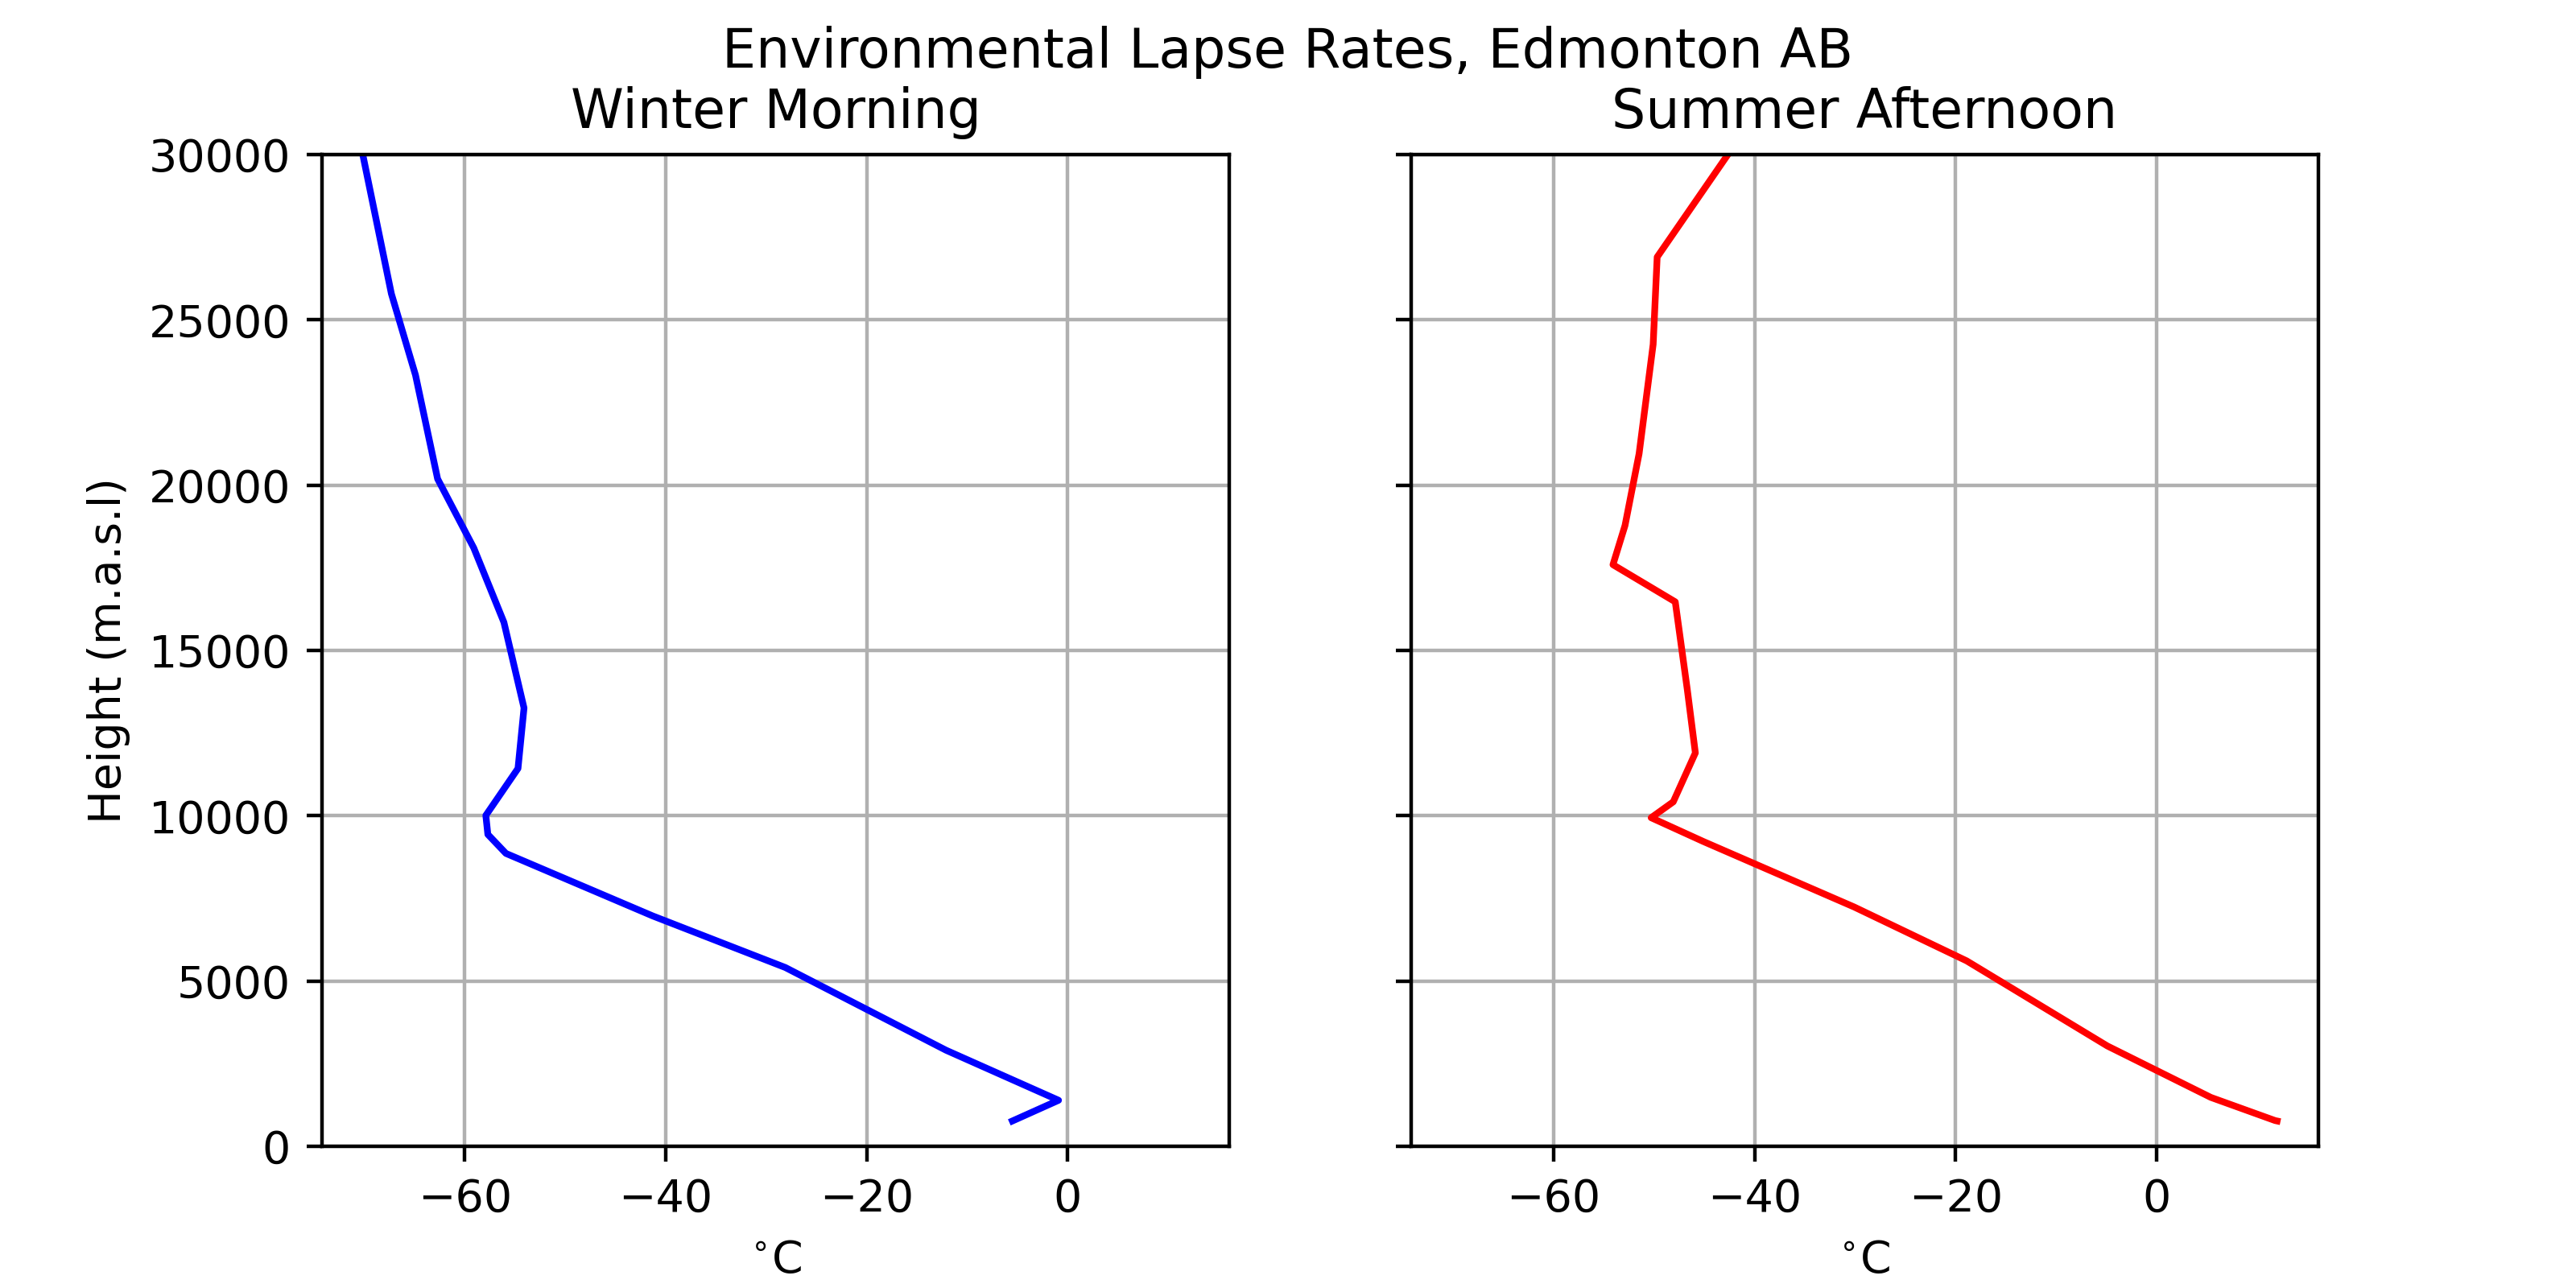
Environmental Laps Rate (ELR)
| Height (m.a.s.l) | ELR K/m | |
|---|---|---|
| 1 | 17 | NA |
| 2 | 271 | 0.0154 |
| 3 | 904 | -0.0013 |
| 4 | 1592 | 0.0061 |
| 5 | 3172 | -0.0038 |
| 6 | 5790 | -0.0066 |
| 7 | 7430 | -0.0083 |
| 8 | 9410 | -0.0074 |
| 9 | 10600 | -0.0091 |
| 10 | 11990 | -0.0075 |
| 11 | 12165 | -0.0057 |
| 12 | 13740 | 0.0015 |
| 13 | 16230 | 0.0006 |
| 14 | 18440 | 0.0006 |
| 15 | 20510 | -0.0006 |
| 16 | 23660 | -0.0005 |
Environmental Lapse Rates (ELR)
The ELR can vary drastically by location, time of day, and season.
Convection
Cumulus clouds form when warm air is from the surface is convected upwards and cools to its \(T_d\)
Convection (iClicker)
What time of day are cumulus clouds most likely to form?
- A Sunrise
- B Mid-afternoon
- C At sunset
- D Midnight
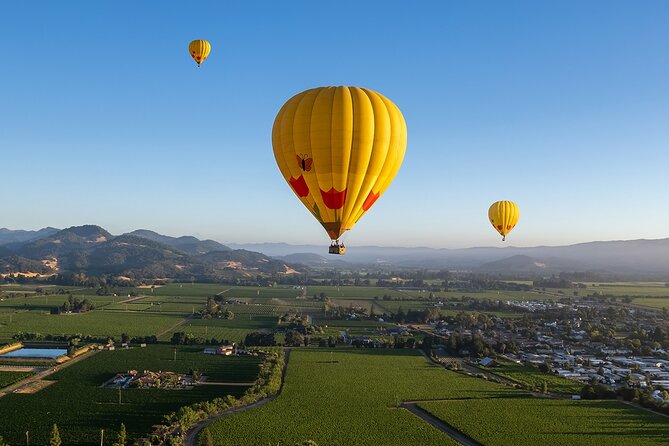
Positive Buoyancy
Hot air balloons rise, by heating the air inside the balloon
- The becomes less dense than its surroundings, giving it positive buoyancy
Negative Buoyancy
When air cools relative to it’s surroundings, it will sink.
- Negative buoyancy causes cold air to flow downhill over mountains like water
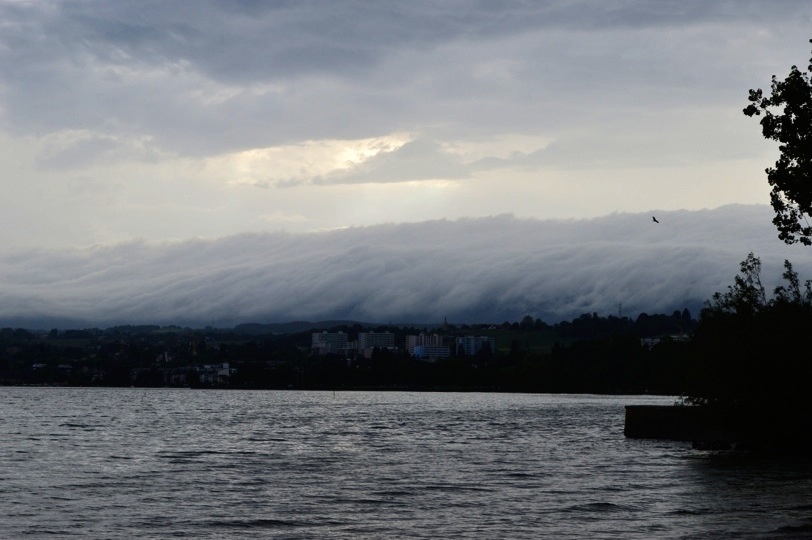
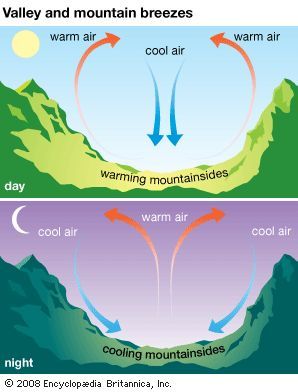
Anabatic vs. Katabatic
Anabatic: upward flow along a slope due to warming of air at the surface
Katabatic: downward flow along a slope due to cooling of air at the surface
- Responsible for “Arctic Outflow” events. Locally known as a squamish
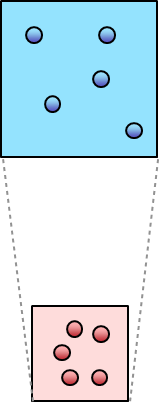
Adiabatic Processes
Even though the heat content of the parcel is conserved, \(T\) changes because the air pressure (\(P\)) decreases with height and the volume \(V\) of the parcel changes.
- On ascent, \(P\) decreases, the parcel expands and the work done causes the parcel \(T\) to drop.
- The reverse is true if the parcel sinks
- It compresses and warms.
- See Equation 2
- The reverse is true if the parcel sinks
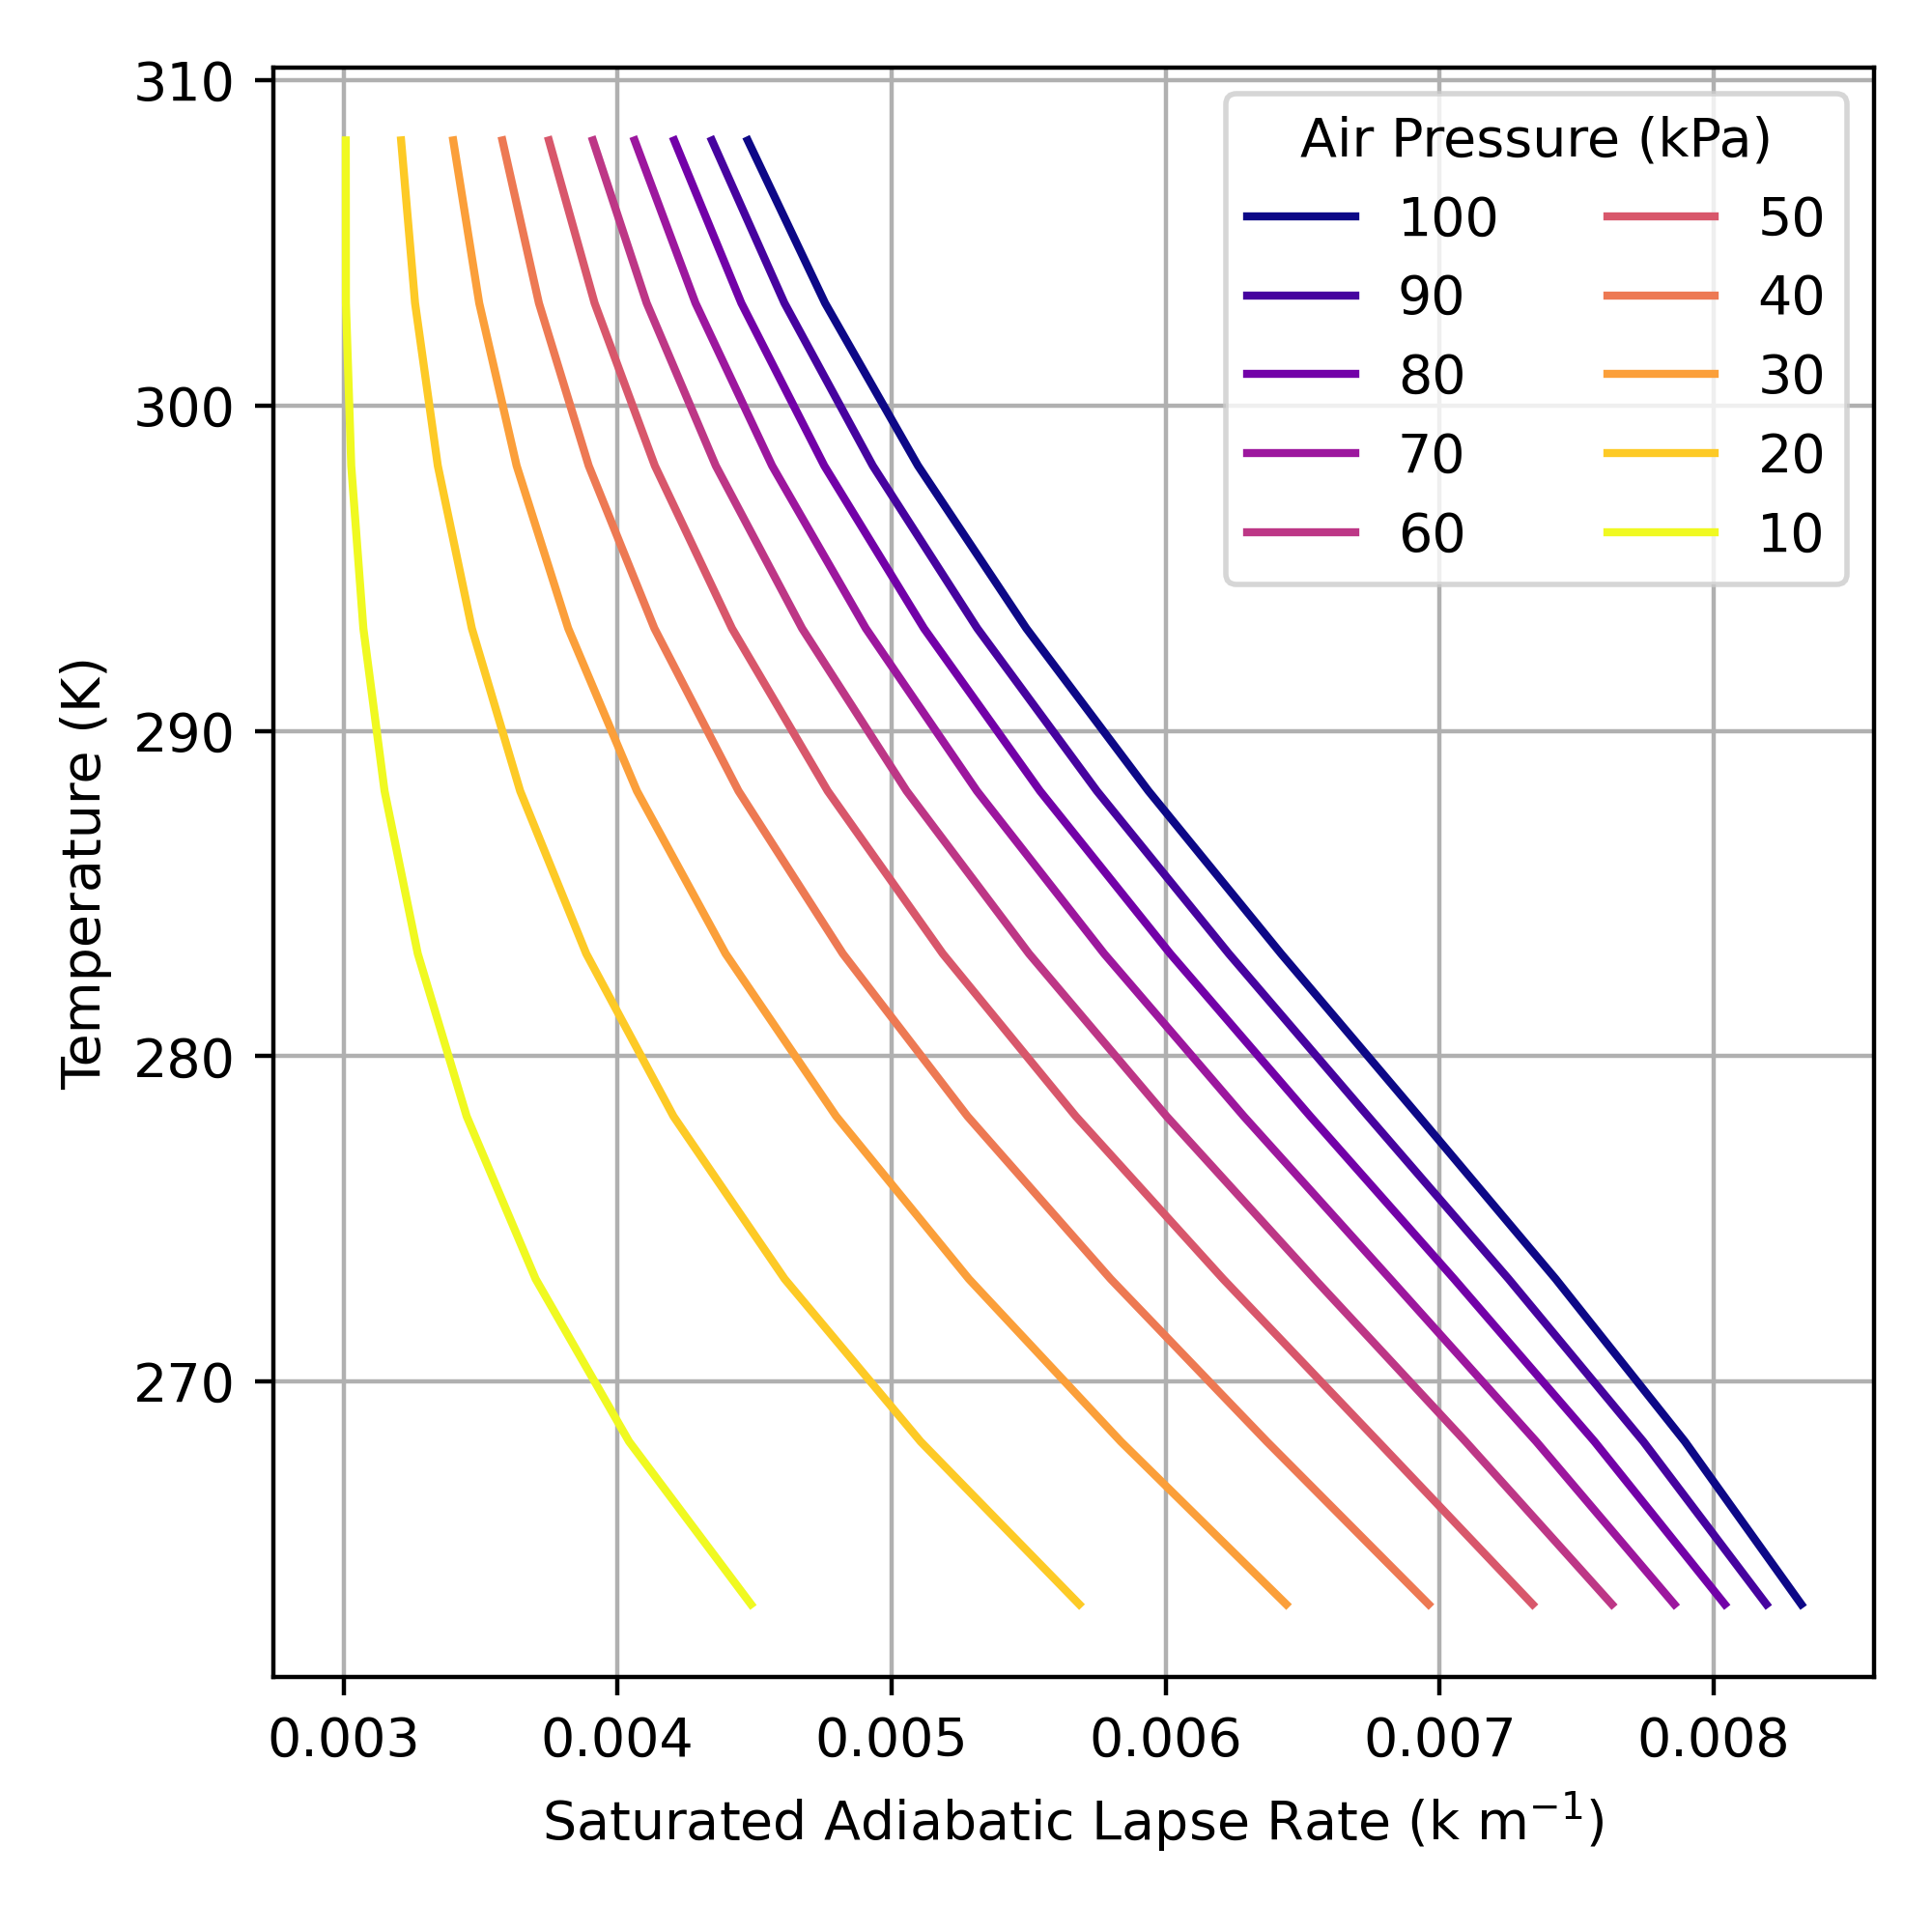
Saturated Adiabatic Lapse Rate
The SALR is non-linear function of \(T\) and \(P\)
- \(T\) varies as a function of \(P\)
- The latent heat released by condensation varies with \(T\)
- The amount of water that must condense also varies with \(T\)
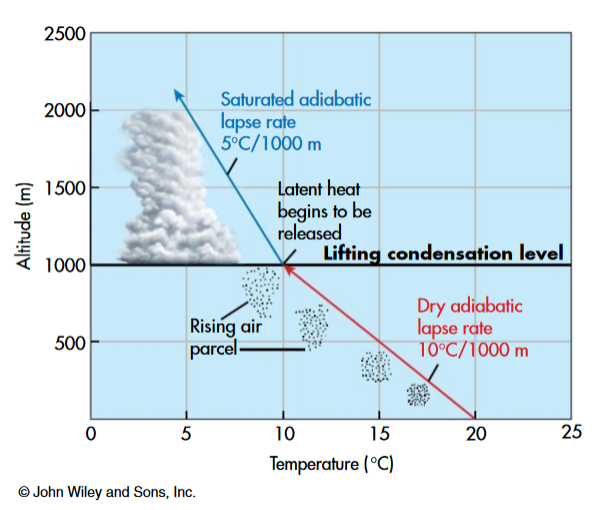
Lifting Condensation Level
The lifting condensation level (LCL) is the height to which a parcel must be lifted for condensation to occur.
- The transition between the DALR and the SALR
- Corresponds to bottom of a cloud layer
Lifting Condensation Level
You can identify the LCL using this equation:
\[ LCL = \frac{T_{dz_1}-T_{z_1}}{DALR}+z_1 \qquad(4)\]
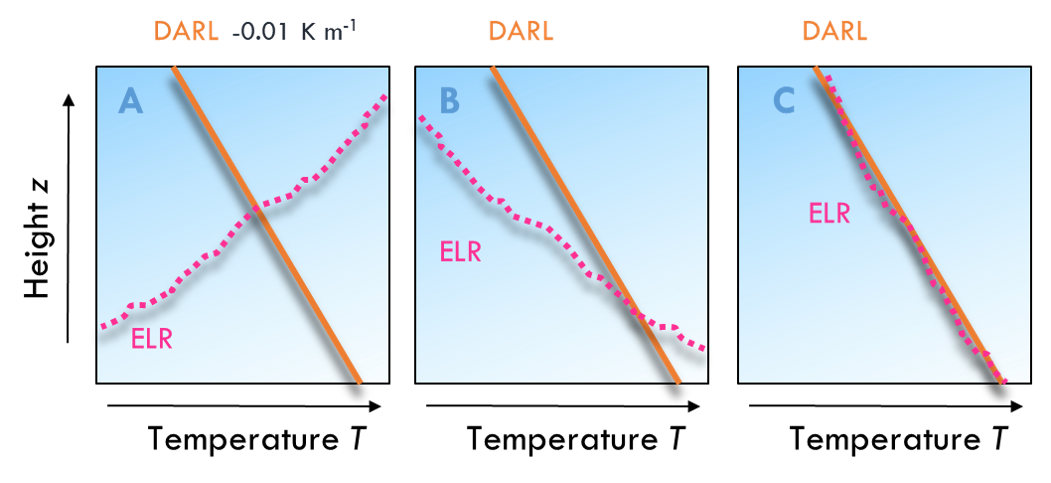
Air Parcel Stability
- Stable: if the parcel is displaced vertically, it will return to its original position
- Unstable: if the parcel is displaced vertically, it will accelerate away from its original position in the direction of the initial displacement
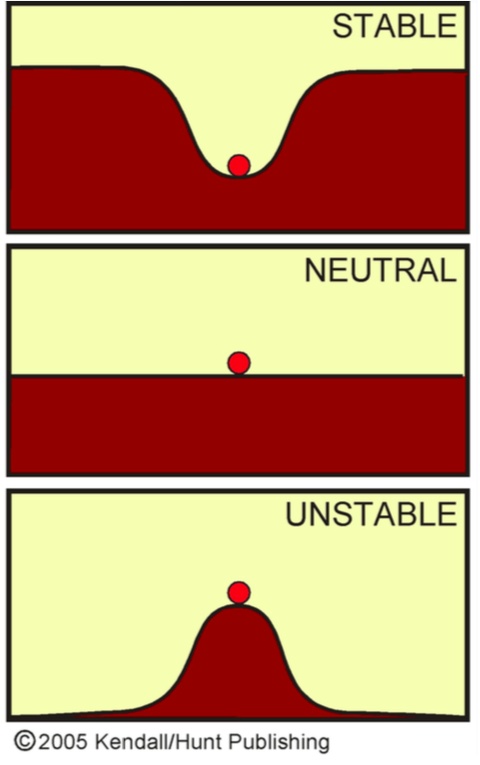
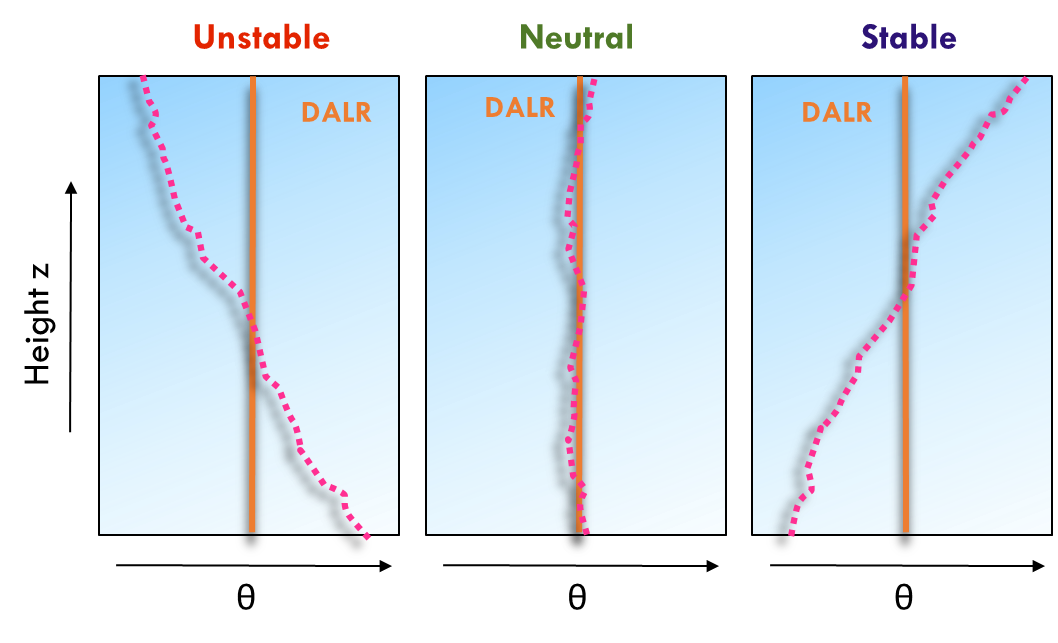
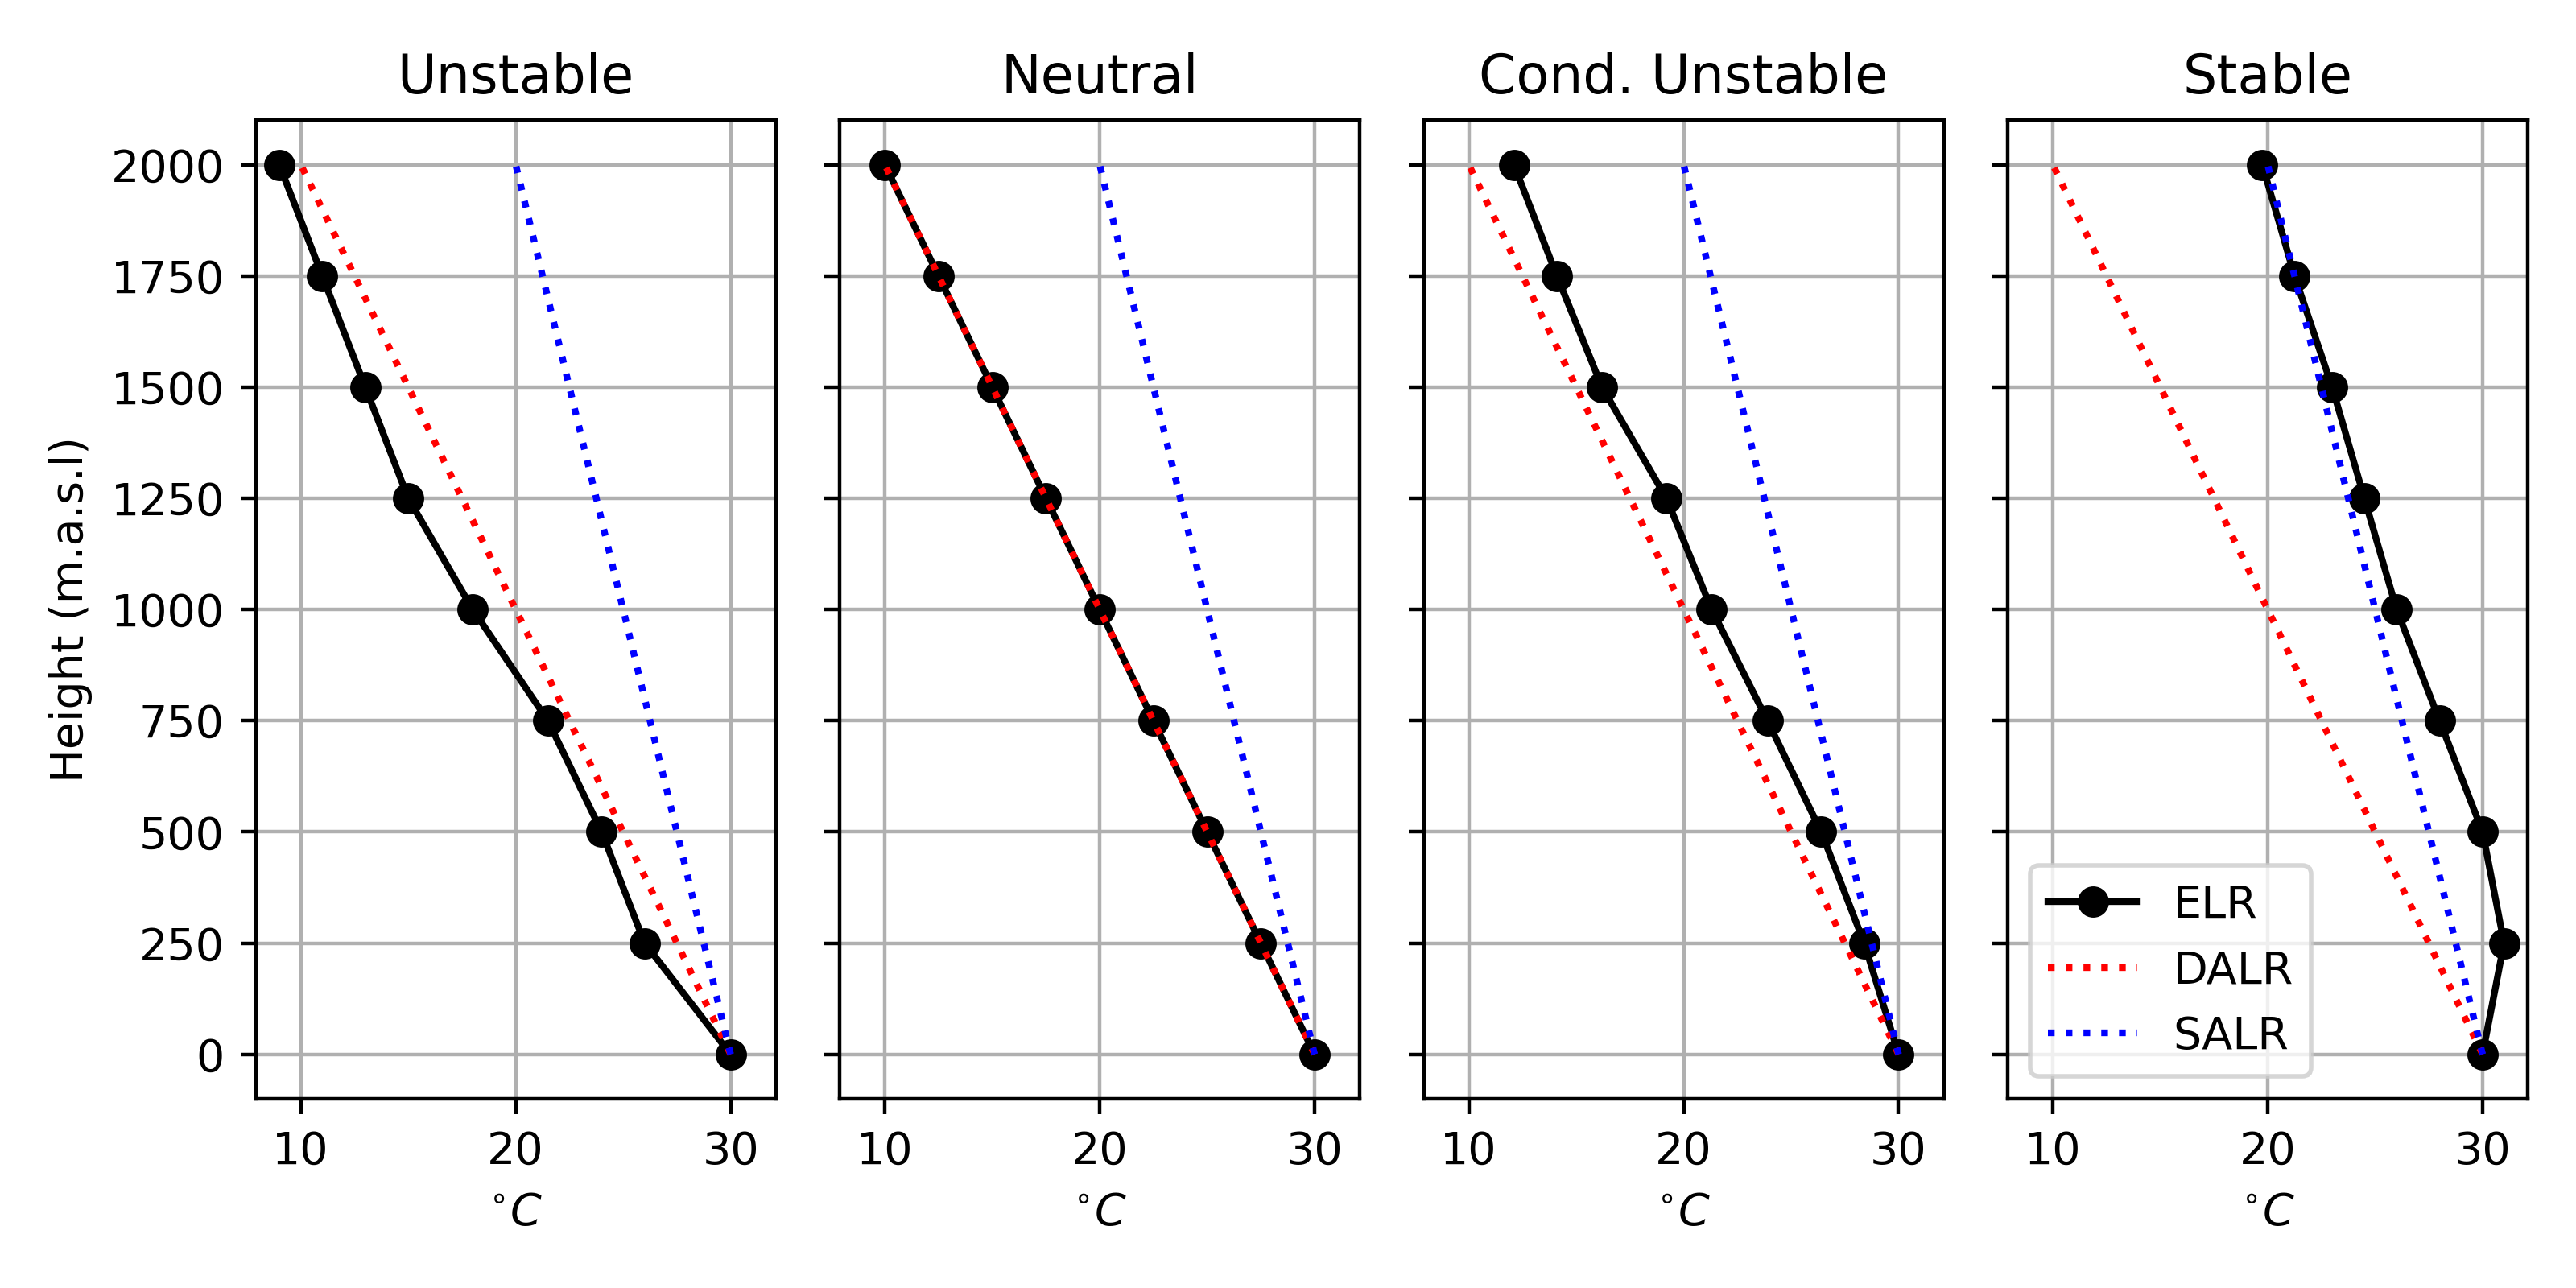
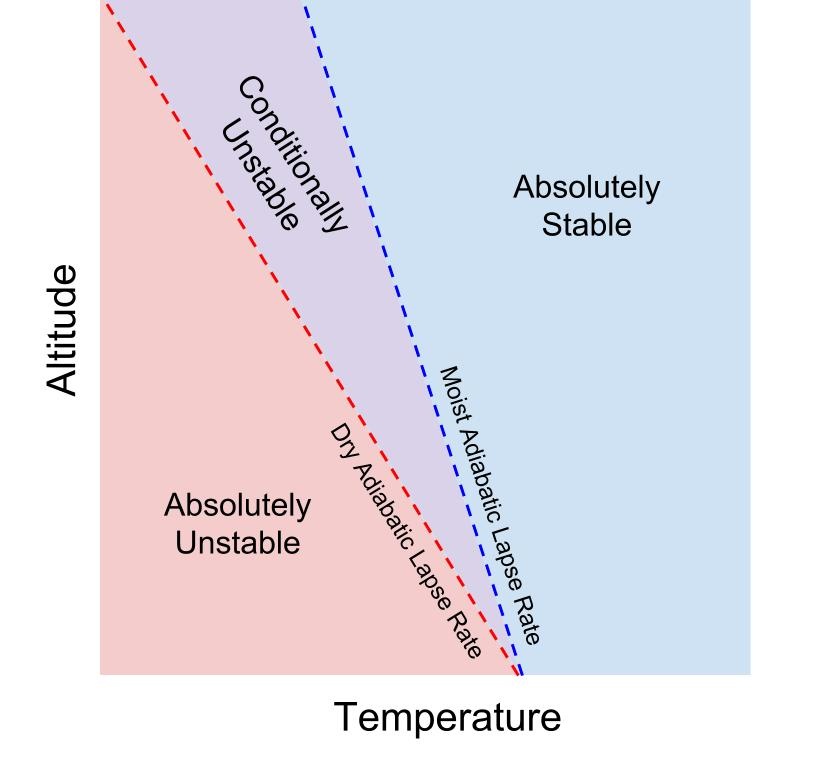
Classifying Stability
Classifying Stability
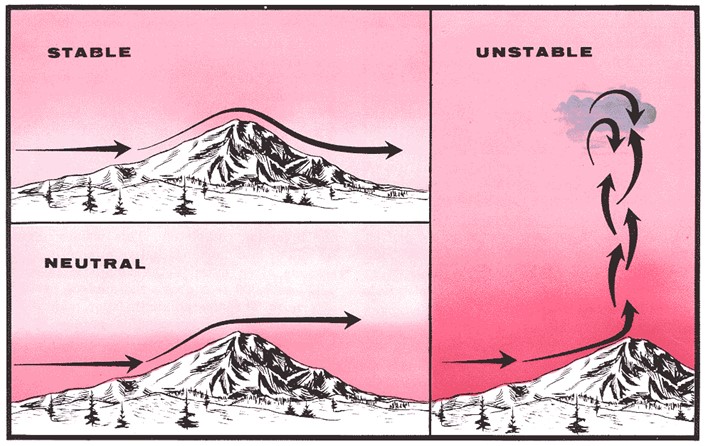
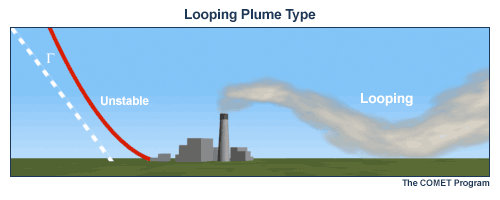
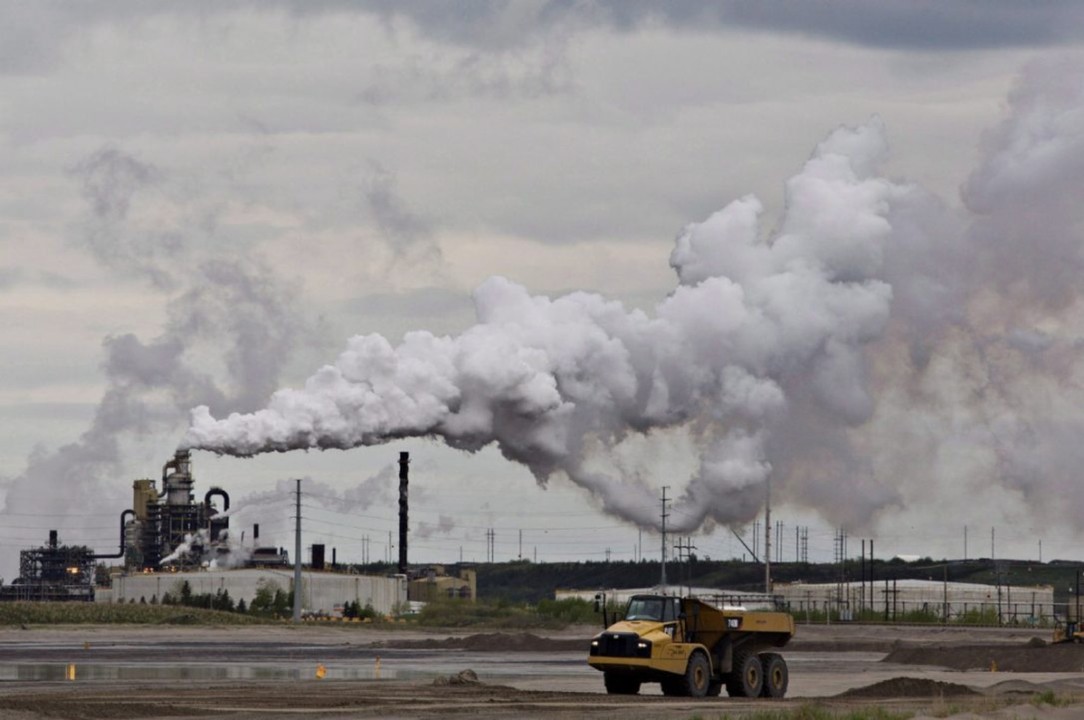
Unstable
The plume shape is because convection cause eddies, which look like ‘loops’. These eddies cause mixing in the atmosphere..
Unstable
These conditions promote convection, which in certain cases can lead to the formation of thunderstorms
Stable
Found near the ground at night if \(R_n\) << 0 and little wind, when warm air moves over colder surfaces, or sinking of warm air aloft. Poor for dispersion and mixing.
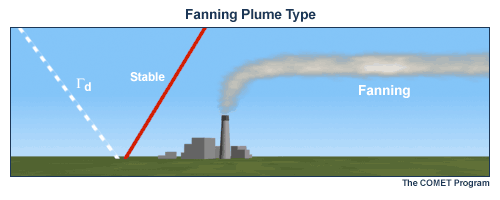
Stable
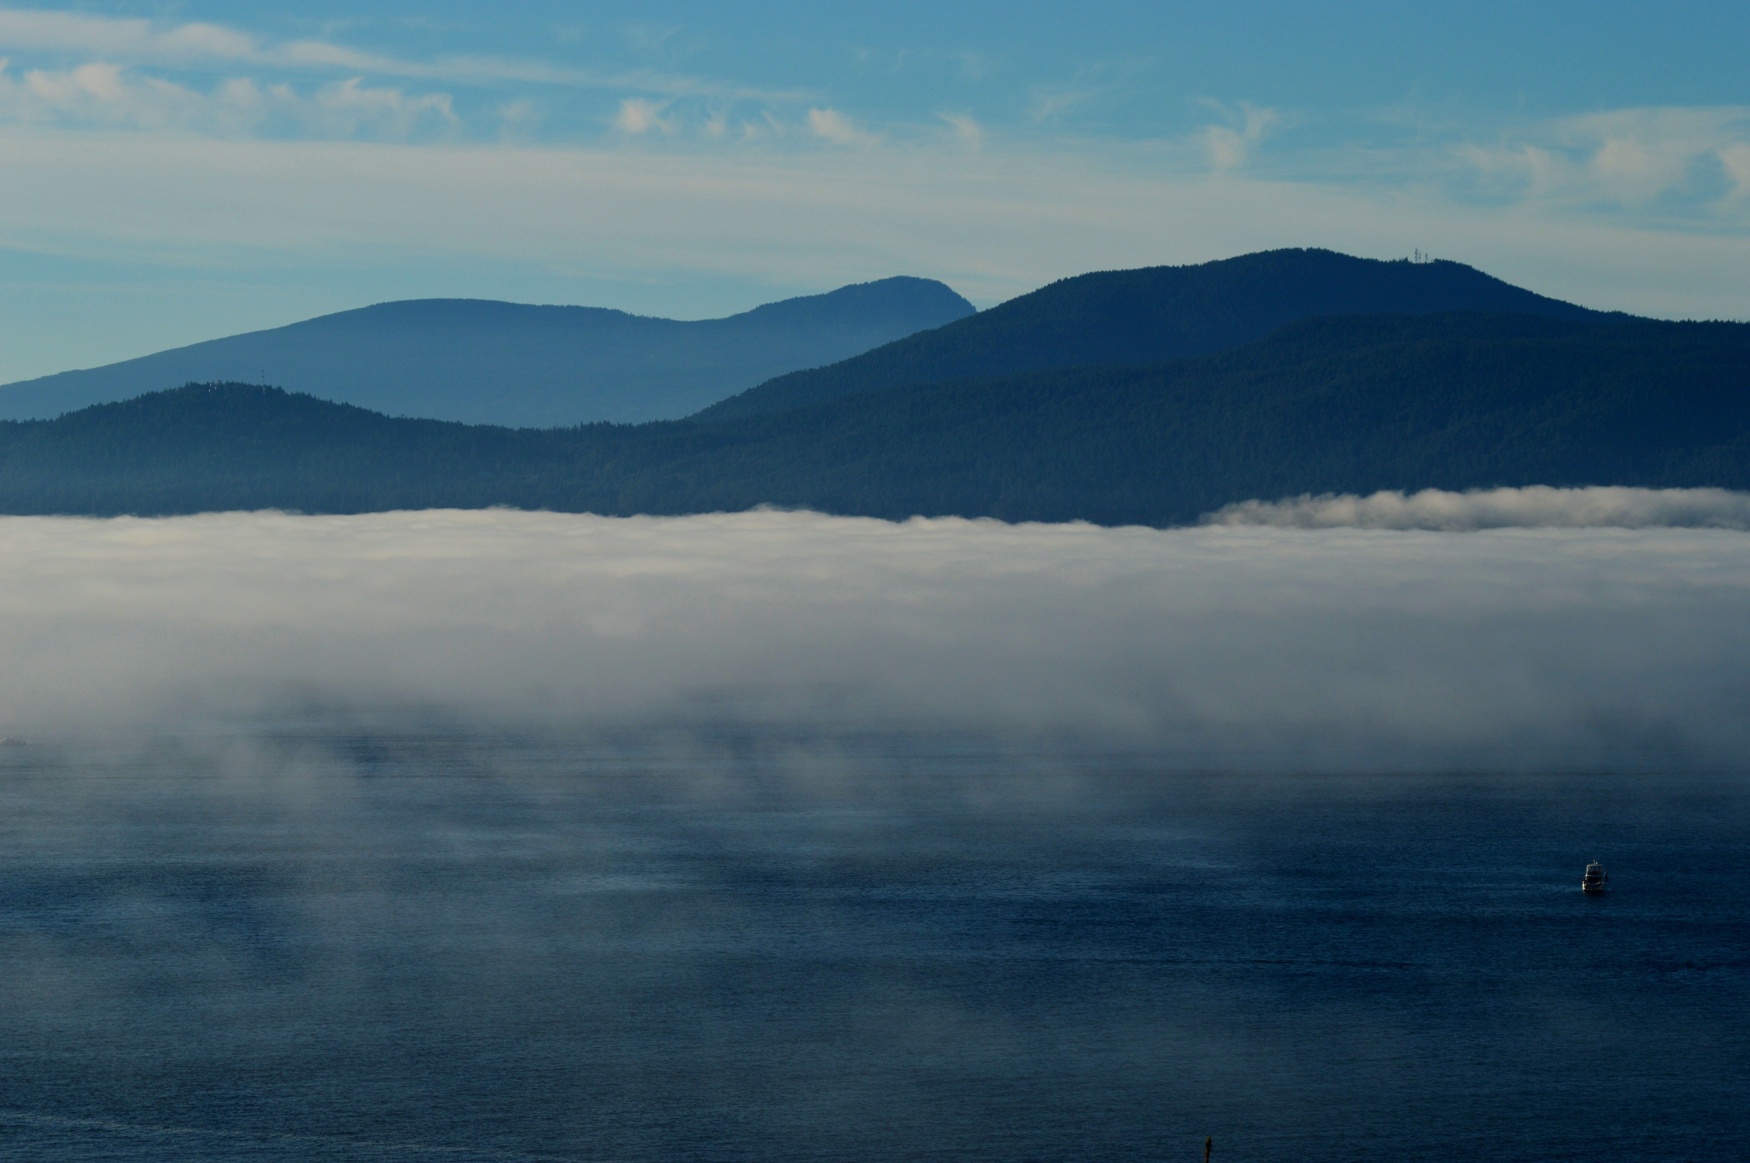
Stable conditions promote clear cloudless skies and suppress precipitation.
- Common in coastal BC during the summer
- Pacific high pressure systems produce temperature inversions
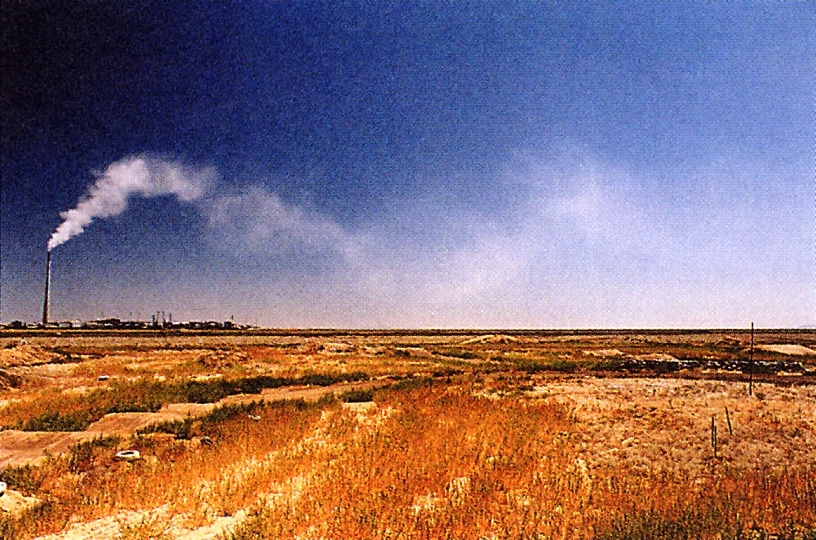
Neutral
Typically found when there is little surface heating or cooling (overcast) or when strong winds thoroughly mix the air. Does not aid or restrict dispersion and mixing, plumes are conic and steadily occupy larger air volume.
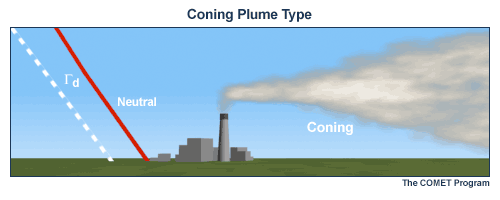
Neutral
Typically found when there is little surface heating or cooling (overcast) or when strong winds thoroughly mix the air. Does not aid or restrict dispersion and mixing.

Conditionally Unstable
When the ELR is between the DLAR and the SALR
- Dry air that is lifted will not continue to rise under it’s own power
- Saturated air that is lifted will continue to rise under it’s own power
Conditionally Unstable
When the ELR is between the DLAR and the SALR
- Dry air that is lifted will not continue to rise under it’s own power
- Saturated air that is lifted will continue to rise under it’s own power
Conditionally Unstable
These conditions can also produce thunderstorms
- If a trigger is present to initiate lift
- e.g., a cold front can produce a squall line
Test your knowledge (iClicker)
Which is an unstable situation?
Potential temperature profiles