Lab 1: The UBC Climate Station
This assignment is worth 15 points.
Objectives
- Become familiar with the UBC Climatological Station and be able to identify radiation and other meteorological instrumentation, what they measure, and units of measurement
- Describe meteorological conditions including short-wave radiation, wind speed and direction, temperature and precipitation
- Explain patterns and trends observed in climate data
1 Totem Field Climate Station
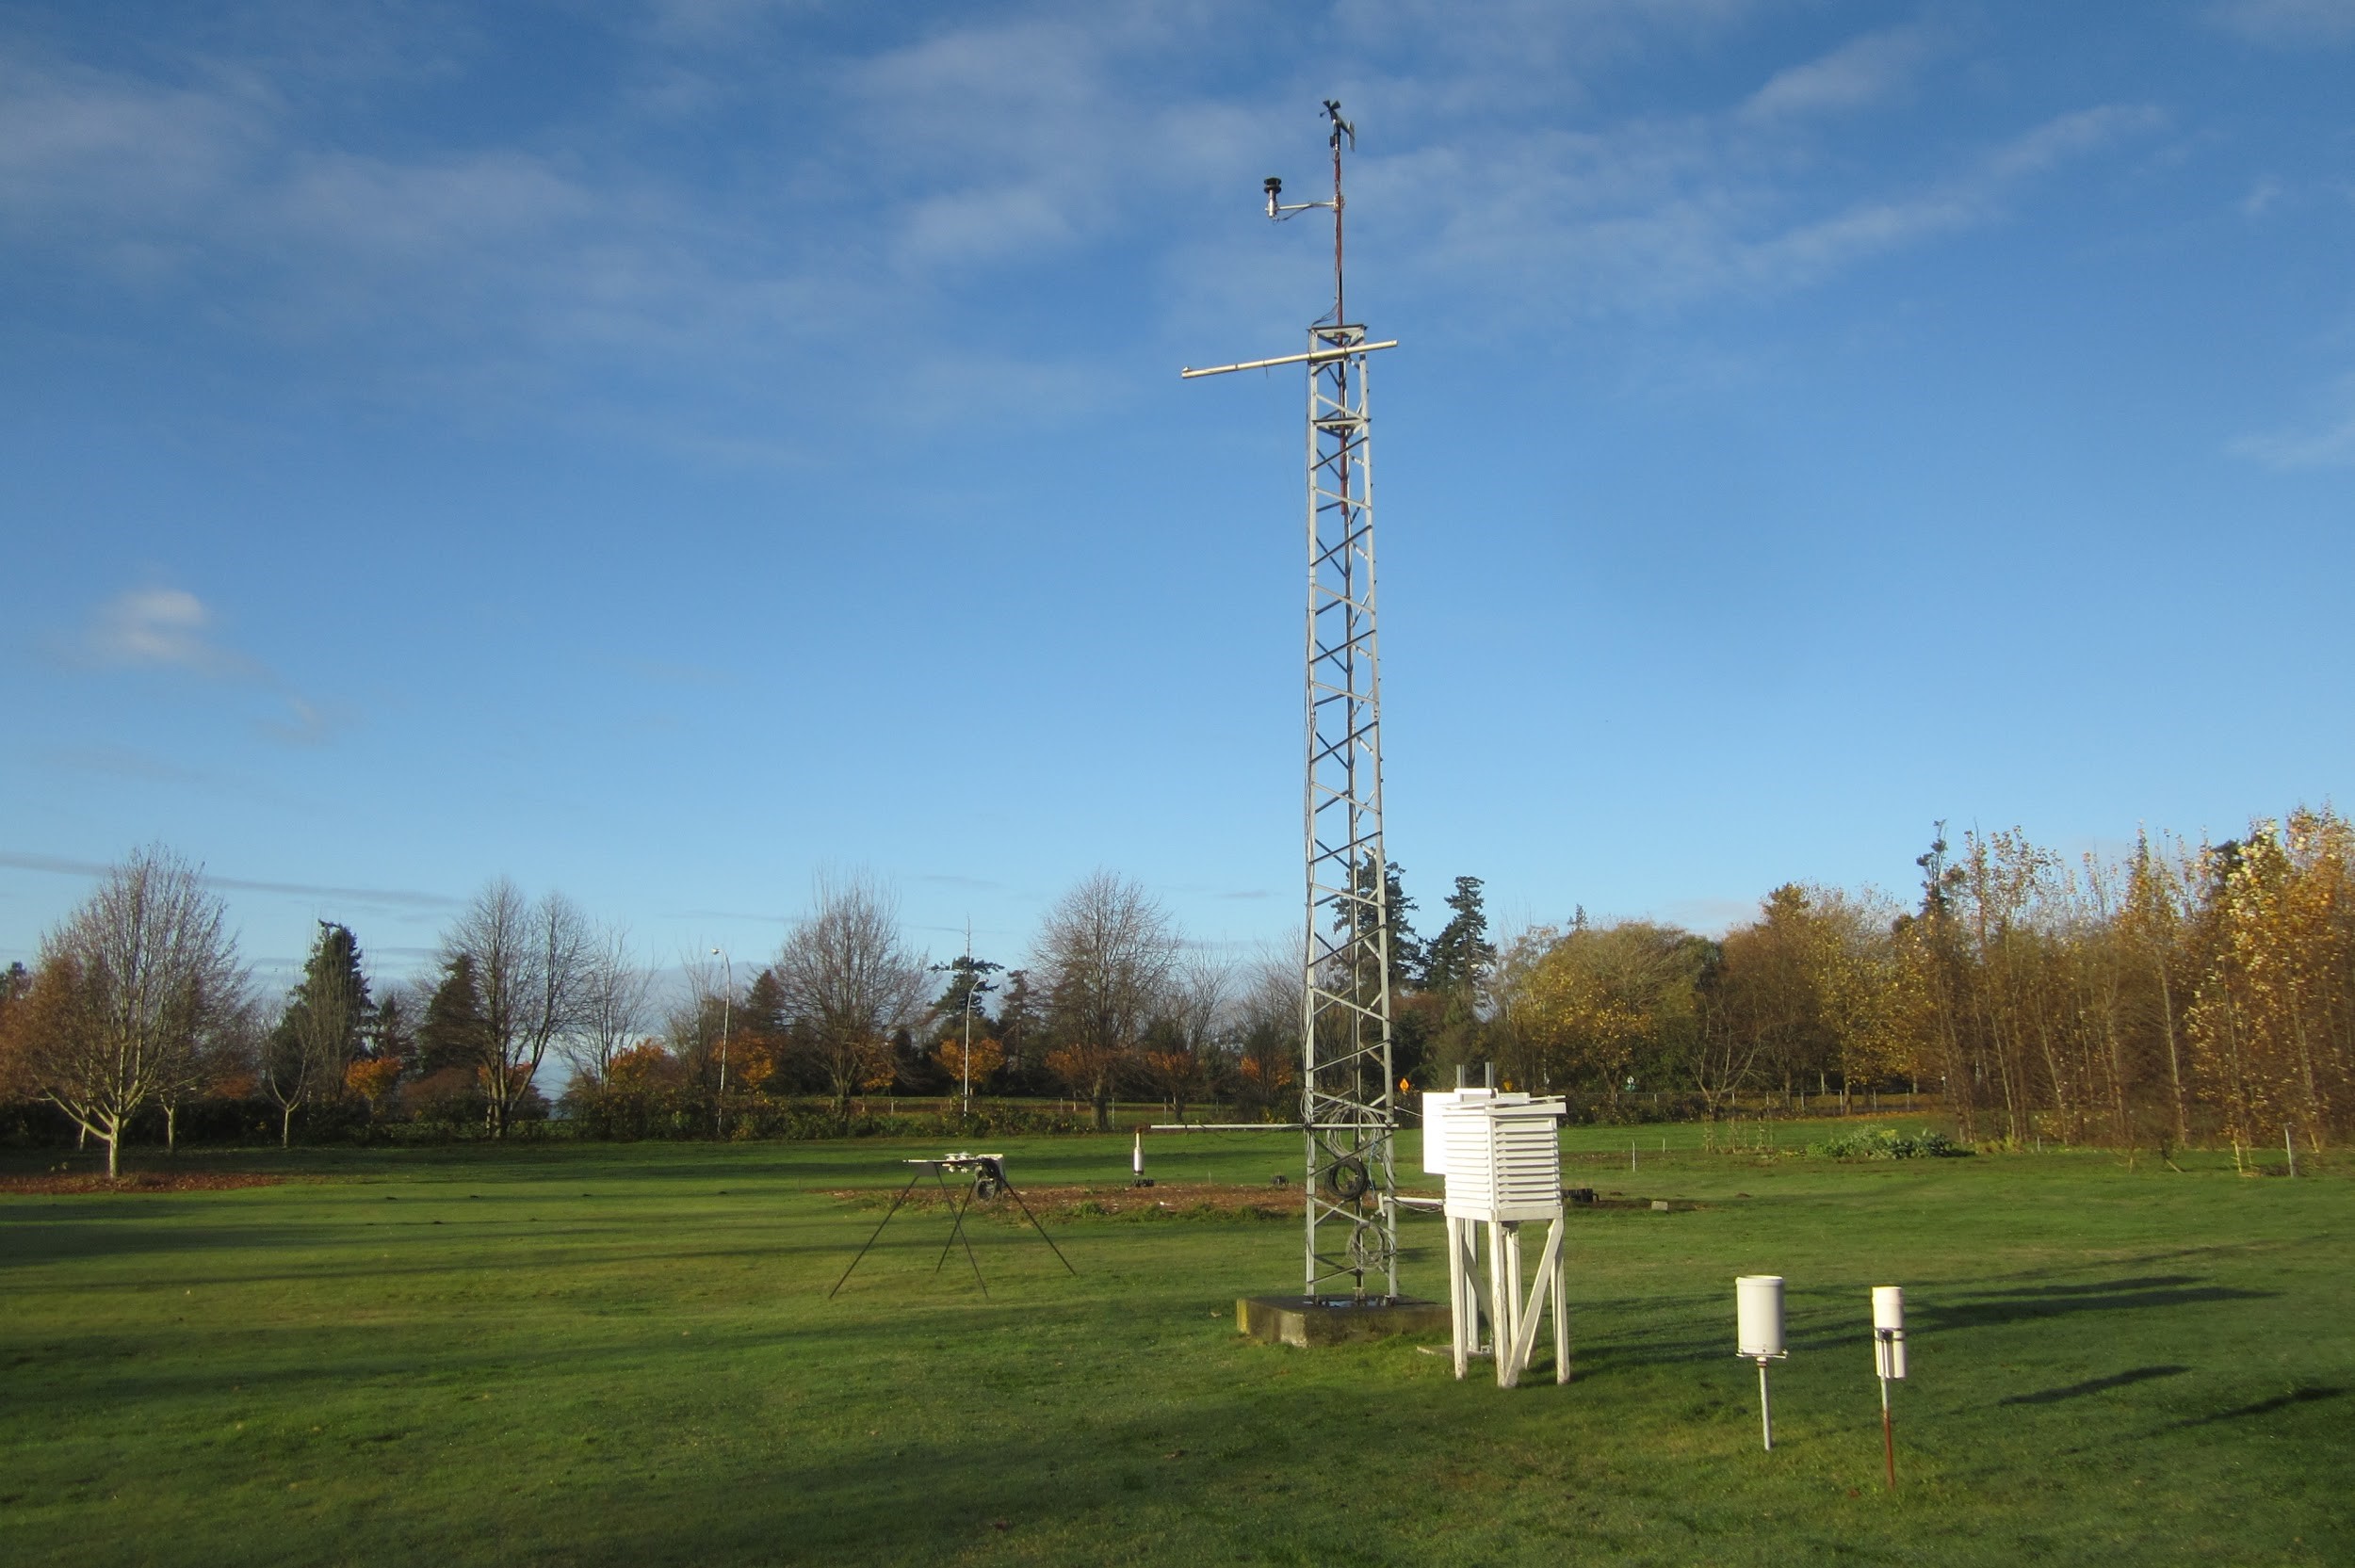
The UBC Climatological Station at Totem Field (Figure 1) provides high-quality measurements of atmospheric variables such as temperature, humidity, wind, precipitation, snow, and radiation. Researchers, students, plant operations, UBC Botanical Garden and the UBC Farm are relying on these data to monitor local weather, growth conditions, climate statistics and climate change on the UBC campus, for example, to support snow removal operations, to determine plant growth conditions, or in the evaluation of advanced energy conservation systems in new buildings.
- Current projects ongoing at the site include the continuing efforts of the Faculty of Land and Food Systems in collaboration with the Department of Geography to maintain a long-term climate record for the UBC campus operations and services, meteorological instrument testing and calibration.
History and Scope of the Station
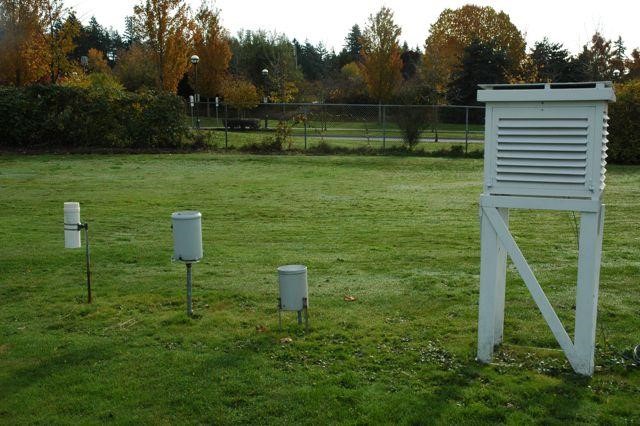
The UBC Climatological Station was established in 1957 at UBC Point Grey Campus west of the Agronomy Barn on Agronomy Road. By 1961 the UBC Climatological Station had achieved the necessary standards to be classed as an Ordinary Climatological Station by the Environment Canada Climatological Network (Hare and Thomas, 1979). In the early 1970s, campus development forced its relocation further south, to the Totem Research Station (Figure 2). The station is located 100m a.s.l. with an open exposure to the majority of the climatic elements.
Standardization
Any site of a climatological station must meet basic criteria before its data will be accepted by Environment Canada. For example, the surroundings must be reasonably flat, there should be no major obstacles to airflow, no significant obstruction to the horizon, no extraneous sources of heat, vapor or dust and the surface should consist of short grass. Similarly, the instrumentation must conform to Environment Canada standards. The data gathered from a climatological station are to be related to large-scale air mass and regional characteristics not the microclimate of the site. Insistence on these points assures users of site and instrument standardization so that different stations can be compared within expected limits of accuracy.
Climate Variables Measured
The station is equipped with an electronic data logger, which makes automatic measurements of climate variables every ten seconds, and half-hour average values are then calculated and stored in the memory of the data-logger. The table below (Table 1) lists the variables measured at the UBC Climatological Station. This is followed by discussion of some specific variables measured at the station and some example data from different time periods.
| Variable | Instrument | Level | Units |
|---|---|---|---|
| Short-wave Radiation | Pyranometer | 1 m height A-frame (incoming and outgoing) | W m2 |
| Long-wave Radiation | Pyrgeometer | 1 m height A-frame (incoming and outgoing) | W m2 |
| Air temperature | Thermistor | 1.3 m height | °C |
| Humidity | Thin-film capacitive sensor | 1.3 m height | % |
| Soil temperature | Thermocouples | 10, 20, and 40 cm depths | °C |
| Wind speed / direction | Propeller anemometer | 10m height | m s-1 |
| Snow depth | Sonic ranging sensor | 1.3 m height | cm |
| Precipitation | Tipping bucket rain gauge | 1 m height | mm |
Radiation
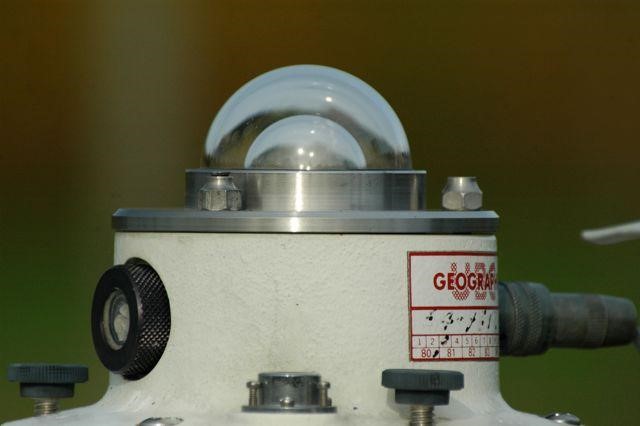
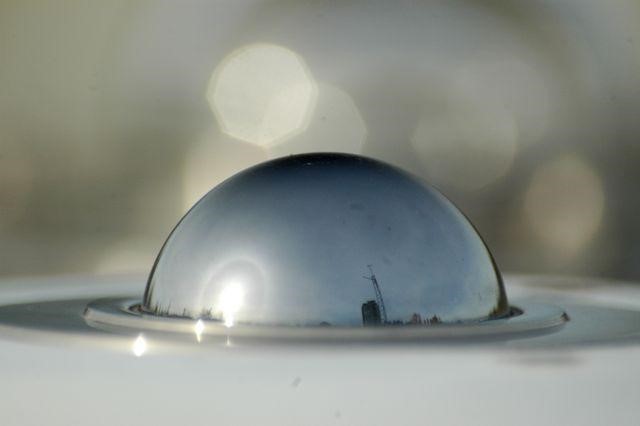
Figure 3 (a) shows a pyranometer, which is used to measure the short-wave (SW) radiation at the station. Shortwave radiation is also know as solar radiation, because it is the primary wavelength of radiation emitted from the Sun. The pyranometer contains a small black absorber disk inside a glass dome whose radiative properties allow only radiation with wavelengths (\(\mu\)) between 0.3 and 3 \(\mu m\) to pass through. As radiation reaches the absorber disk, it will warm up and create a temperature difference to the rest of the body of the instrument whose temperature varies only slowly. The difference can be directly related to short-wave receipt.
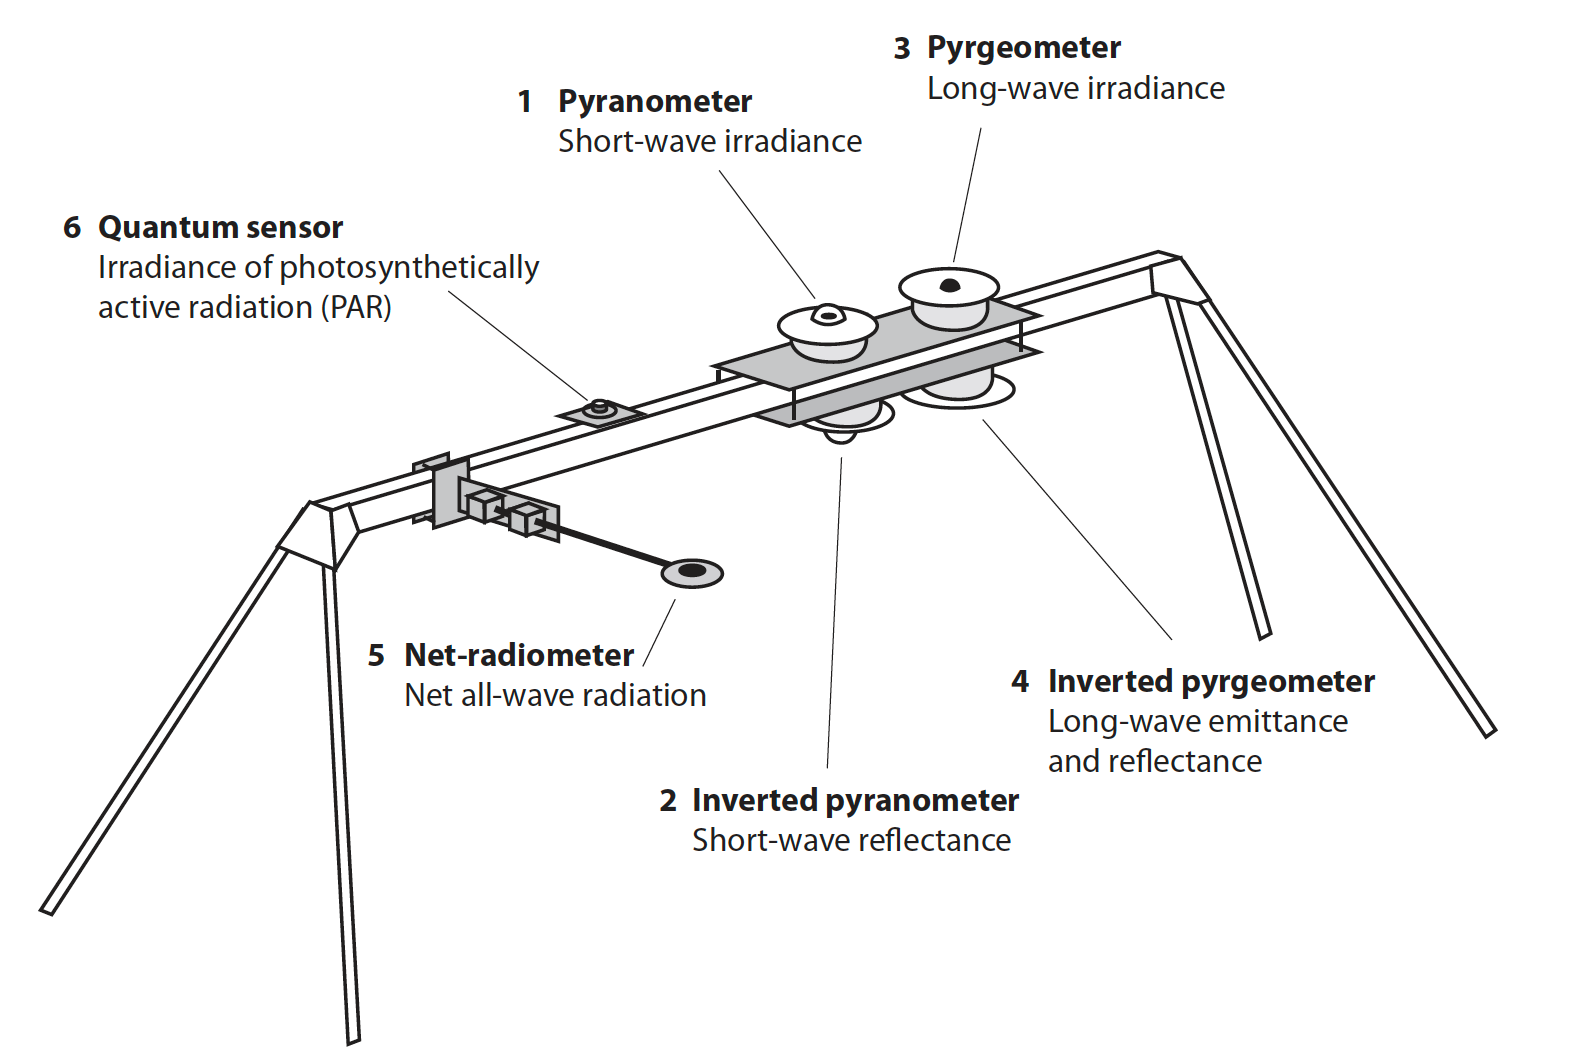
Figure 3 (b) shows a pyrgeometer, which is used to measure the thermal radiation, also know as long-wave (LW) radiation. It works in a similar way as a pyranometer, except it measures wavelengths between 4.5 and 100 µm. Figure 3 (c) shows how sets of pyranometers and pyrgeometers, one of each pointing upward toward the sky and downward toward the ground, are used to measure both incoming and outgoing short-wave and long-wave radiation respectively. We’ll take a more in depth look at radiation in lab 2.
Air & Soil Temperature
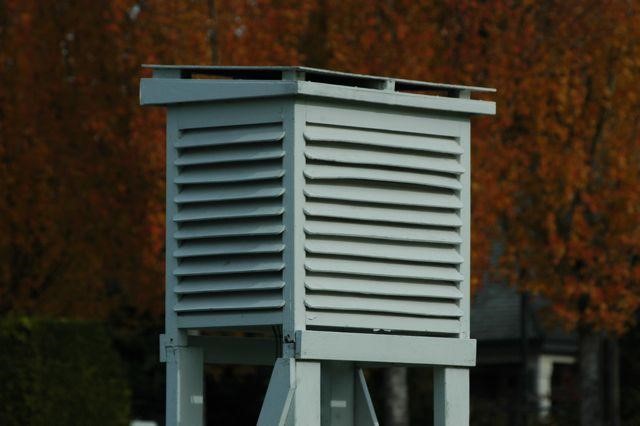
Air temperature and humidity are measured in a Stevenson screen Figure 4 designed to protect the instruments from liquid water (rain/snow) and shade them from solar radiation, but permit free air circulation.
Soil temperatures are measured using Copper/Constantan thermocouples. These are wires made up of two different metals that carry a small electrical signal. The transfer of electricity between the two metals is dependent upon temperature, and from that we can calculate temperature for whatever medium the thermocouple is in contact with.
- Figure 5 shows an example of air and soil temperature data collected at Totem field during the 2021 Heatdome.
- You can move your cursor over the traces (lines) to see the values of the different variables.
- Think about how air and soil temperatures compare to one another in this example.
Precipitation
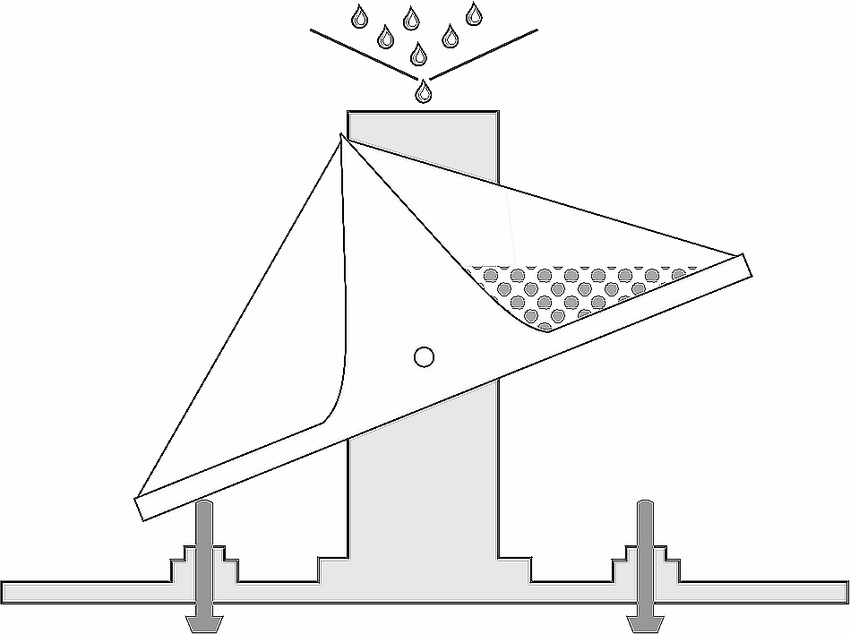
Rainfall is measured using a tipping bucket Figure 6 (b), which works by funneling precipitation into small seesaw-like counter Figure 6. The depth of new snowfall and the total depth of the snow lying on the ground was historically measured with a meter stick. It is now measured using an automated sonic snow depth sensor Figure 6 (c).
- Liquid water equivalent of the snow is typically estimated using a 10:1 ratio
- 10 mm of snow ≈ 1 mm of rainfall
- However, this is just an average, and accuracy of this estimate can vary drastically depending on the type of snow.
- In Vancouver, we typically get “wet, heavy snow” which has a much higher liquid water equivalent, with a ratio closer to 5:1. Using the standard 10:1 ratio for a typical Vancouver snowfall would underestimate liquid precipitation.
- “Powder”, the light, fluffy snow common in dry mountainous areas that makes for great skiing has a much lower liquid water equivalent, with a ratio closer to 20:1.
- Figure 7 shows an example of precipitation data collected at Totem field during November 2021, when an Atmospheric River caused widespread flooding across the region.
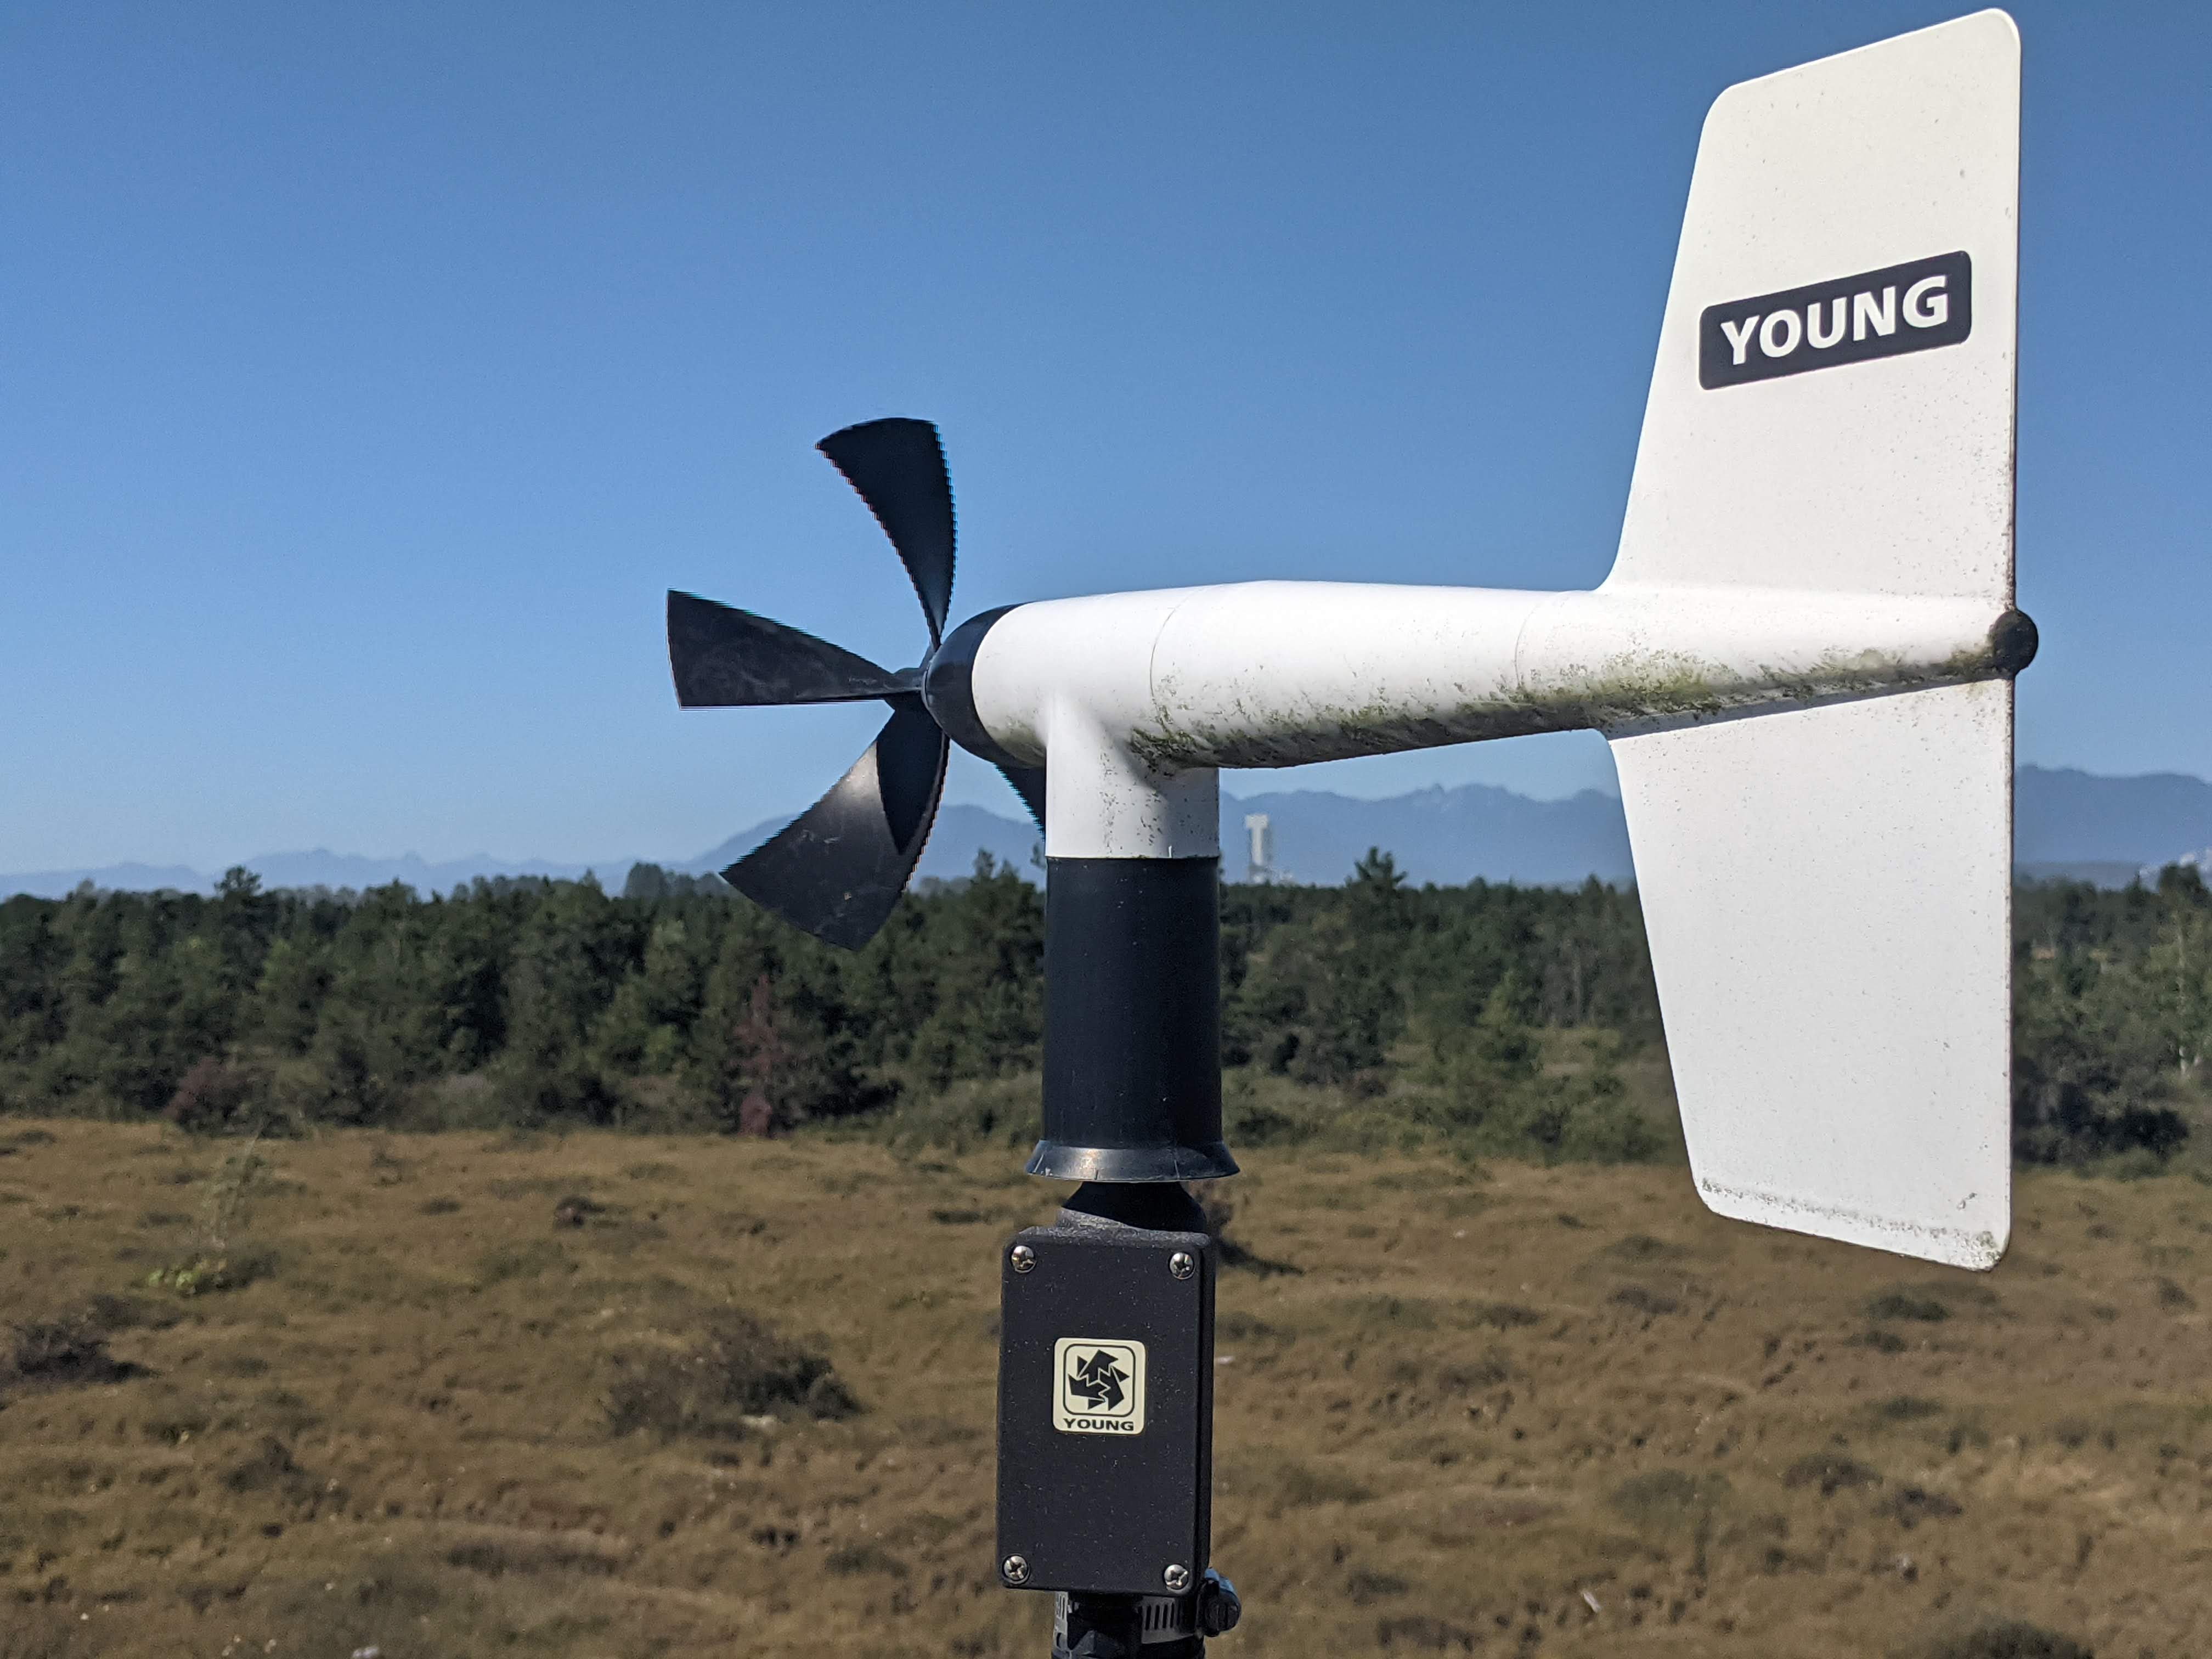
Wind Speed
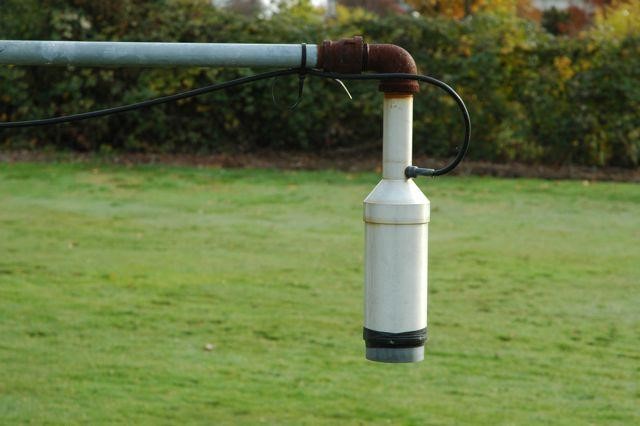
Wind speed (horizontal) and direction are measured on a prop vane anemometer Figure 8. The sensor is mounted at 10 m above the surface to avoid the effects of local obstacles such as the instrument shelters Figure 1. Figure 9 shows mean annual wind speeds measured at Totem Field.
- Prop vane anemometers are cheap and function well in most weather conditions, however the mechanical components can degrade over time.
Questions
Question 1 [1.5 points]
Is the climatological station suitably located to provide climatic data representative of the UBC campus and surrounding areas? Discuss why or why not. You can pan around and zoom in/out on Figure 2 to help you answer this question.
Answer:
Generally speaking its going to be broadly representative of the areas climate conditions however the nearby trees may cause some issues with the wind observations
Since its in an area without dense buildings/concrete, there is some bias relative to conditions farther north on campus which is more densely developed.
Note For TA
Be flexible with this one if they don’t mention these exact points but still give a well thought out answer.
Question 2 [1 points]
Why is a Stevenson screen built with slatted walls, a double roof, and white paint?
Answer:
To shield the thermistor from radiation while allowing air to pass through.
The white paint and the double roof are chosen to effectively reflect short-wave (solar) radiation and prevent warming up of the interior of the screen above air temperature. Short wave-radiation reaching a thermometer would be absorbed and warm it up.
The slatted walls still allow airflow through the screen to keep thermometers near air temperature. Otherwise, in a closed box, the interior temperature of the box would not correspond to air temperature anymore (decoupled).
Question 3 [1 points]
How do air and soil temperatures compare to one another during the 2021 Heatdome event shown in Figure 5? Which variable (air or soil temperature at 10/20/40 cm) has the largest range on a daily basis? Which has the smallest range?
Answer:
Soil temperatures are less variable than air temperatures (i.e., they’re buffered from extreme changes) on both. Soil temps also lag behind air temperatures and decrease with depth in the summer.
The air temperature range is greatest, up to 10 C / day during the heat dome - 5 cm soil T is < 5 C/day, 40 cm barely changes on a daily basis.
Note: (Extra context)
- It takes much more energy to raise the temperature of a volume of soil than it does an equivalent volume of air.
Question 4 [0.5 points]
Fill in the blank(s): indicate the words/phrases that complete the statement.
Using the standard 10:1 ratio for “Powder” snow in a dry mountainous region would ______ liquid precipitation.
Answer:
- Overestimate
Note For TA
Don’t need exact wording - accept synonymous answers.
Question 5 [1 points]
Based on Figure 9, do you think the wind data from the last few years at totem field is accurate? Why or why not?
Answer:
- Not reliable - systematic shift in recent years
2 Earth Science Building Rooftop Weather Station
In addition to the Climatological station at Totem Field, there is also a weather station on the rooftop of the Earth, Ocean and Atmospheric Sciences building. The station was installed in 2007, and has been used to measure temperature, precipitation, wind, and cloud conditions since.
The Atmospheric Science department produces forecasts for the UBC campus and tracks their accuracy using this station. You can view see current weather conditions at the station, along with 3- and 7-day forecasts for the site here. You can also have a look at the webcams from the station to see what the setup looks like.
Questions
Question 6 [1.5 points]
Compare the UBC climatological station at totem field with the one on top of the Earth, Ocean, and Atmospheric sciences building. You can zoom out to location the station on Figure 2 for more context, look at the website and webcams for the EOAS station. Do you think conditions at the rooftop site are representative of the conditions in the surrounding area? Would it meet the standards Environment Canada requires discussed above?
Answer:
At the newer, EOAS rooftop weather station: weather webcams in all 4 directions; time lapse movies for the past 7 days; weather is being forecast for the next 3-7 days (it isn’t just observations as a the UBC climatological station); other measurements include cloud height, freezing level, mean sea level pressure, wind chill, sun rise and sun set time, which are not recorded at the totem station (Accept any other reasonable answers)
It would not be accepted by Environment Canada because its on top of a building - there are obstructions that influence the wind flow for example. Temperature, radiation, etc are probably similar to those on the ground below, but also may not be perfectly representative
3 Climatology
While weather describes conditions at any given time, climate describes the general conditions over time. You can think of climate as “average weather”. For any variable (\(x\)), we can calculate the mean (\(\bar{x}\)) and standard deviation (\(\sigma\)) for \(N\) years of data. With these values, we can then z-score normalize our data:
\[ \bar{x} = \sum_{n=1}^{N} \frac{x_n}{N} \tag{1}\]
\[ \sigma = \frac{\sum_{n=1}^{N} x_n - \bar{x}}{N} \tag{2}\]
\[ z = \frac{x-\bar{x}}{\sigma} \tag{3}\]
These statistics can be helpful because they allow us make comparisons between different time periods, different locations, or even different variables.
- z-score normalization is useful because the result will no longer be in the units of the original variable.
- Instead, it will show how far away any given observation (e.g., Total precipitation in on year) is from the mean.
- This is also helpful because it lets us make a more direct comparison between variables that are in different
Long-term Trends
One way to assess long-term patterns in a location is to look at deviations from the mean conditions over a period of record.
Mean air temperature at Totem Station since 1960 is 10.2 °C, with a standard deviation of 0.6 °C.
Likewise, mean annual precipitation at Totem Station since 1960 is 1130.8 mm, with a standard deviation of 229 mm.
Using these values we can z-normalize temperature and precipitation data from the Totem station to investigate long-term patterns at the site Figure 10.
Climate Normals
To look at the general conditions of a given location, we often use something called “Climate Normals”. These are 30-year averages of temperature and precipitation, in decadal blocks, eg. 1961 to 1990, or 1991 to 2020. They can give you an general overview of the seasonal conditions at a location.
Questions
Question 7 [2 points]
What does Figure 10 tell you about yearly air temperatures and precipitation at UBC over the last 60 years?
Answer:
- Air temperatures have been increasing. Most of the warmest years are in the second half of the period of record and each year in the last decade had above average temperatures.
- Unlike air temps, there isn’t a discernable trend in precipitation.
Question 8 [2 points]
Inspect Figure 11; and toggle through the different periods (1961-1990 thru 1991-2020). On average, which periods are the coldest and warmest at Totem Field respectively? Is there any noticeable change in average monthly air temperatures from the earliest period to the the latest? If so in which months and by how much?
Answer:
- July/August is the warmest. December/January is the coldest. Air temperatures have increased overall, by less than a degree in most months. The most significant increase is January, which went up by 1.3 °C
Question 9 [0.5 points]
How does the total November Precipitation from 2021 shown in Figure 7 compare to a “typical” November as defined using the 1990-2020 climate normals shown in Figure 11?
Answer:
- November 2021 was an extreme month, with more that double the typical November precipitation.
Question 10 [4 points]
Climate normals for stations across Canada can be found here. You can search for stations by name, province/territory, or proximity to specific locations. For the most recent period available, pick two stations: one from Quebec, and one from Nunavut, and find their climate normal graphs. Compare the seasonality of monthly average temperatures and total precipitation to the the climate normals covering the same time period for Totem Station, discuss the similarities/differences you see. Take screenshots of the climate normal graphs and include them in your answer.
Answer:
Answer will be dependent upon specific location they select, but …
Nunavut will be Much colder and drier - with only summer months above freezing
Quebec will be colder in winter and warmer in summer (unless they pick a station in northern Quebec). Precipitation will be more evenly distributed through the year, but overall lower than Vancouver.